Philadelphia, Pennsylvania · Neighborhood crime trends

Philadelphia North

17 neighborhoods - a quarterly race to the lowest crime rate.

Crime Trends: Neighborhoods compared - each quarter from Q1 2022

Philadelphia as a whole averaged 25.7 crimes for every 1,000 residents per quarter in Q2 2026, while North averaged 19.4, hence it is generally safer when all crimes are considered.

How do the 17 neighborhoods of North compare? In Q2 2026 the police recorded 6,124 crimes across them, 19.4 for every 1,000 residents. That is 3.0% above a year earlier and 17.5% above Q1 2022, the first quarter we track.

Burholme has the lowest rate of the everyday neighborhoods (10.9 per 1,000), followed by Melrose Park Gardens (13.8) and East Oak Lane (14.8). Logan has the highest (30.3).

Use the RACE CHARTS below to watch all 17 PHILADELPHIA NORTH NEIGHBORHOODs race across 18 quarter periods from Q1 2022 to Q2 2026 - one crime category at a time or all together. The race chart can be used to compare average crime rates by category against Philadelphia's average.

Neighborhood boundaries are defined by OpenDataPhilly / Robert Cheetham (CC BY) and simplified by CrimesLog.
Lowest rate (everyday)
lowest rateBurholme
10.9 crimes per 1,000 residents, Q2 2026
Highest rate
upLogan
30.3 per 1,000, Q2 2026
Whole area, Q2 2026
19.4 per 1,000
up 3.0% above a year earlier · up 17.5% above Q1 2022
Compared
17 neighborhoods
315,693 residents · 18 quarters

Philadelphia North neighborhood quarterly crime race

Press ▶︎ to watch Q1 2022 to Q2 2026. Tick one crime category or several; hover a bar for the neighborhood. Property crimes includes burglaries and thefts.

Crime categories
Indicated: crimes rate per 1000 residents per quarterAll · safest at the top · square-root scale · Q1 2022 to Q2 202601510255010011.1Burholme9.8Cedarbrook198Crescentville12.7East Oak Lane32.5Fern Rock11.2Fox Chase23.8Germantown, East15.9Lawndale34.2Logan9.3Melrose Park Gardens14.9Mount Airy, East18.1Ogontz15.3Olney14.0Oxford Circle14.7Rhawnhurst15.9Summerdale14.2West Oak LanePhiladelphia Q2 2026 average all crimes (25.7)Numbers are crimes per 1,000 residents per quarter. Zero-crime quarters show 0 and rank safest.
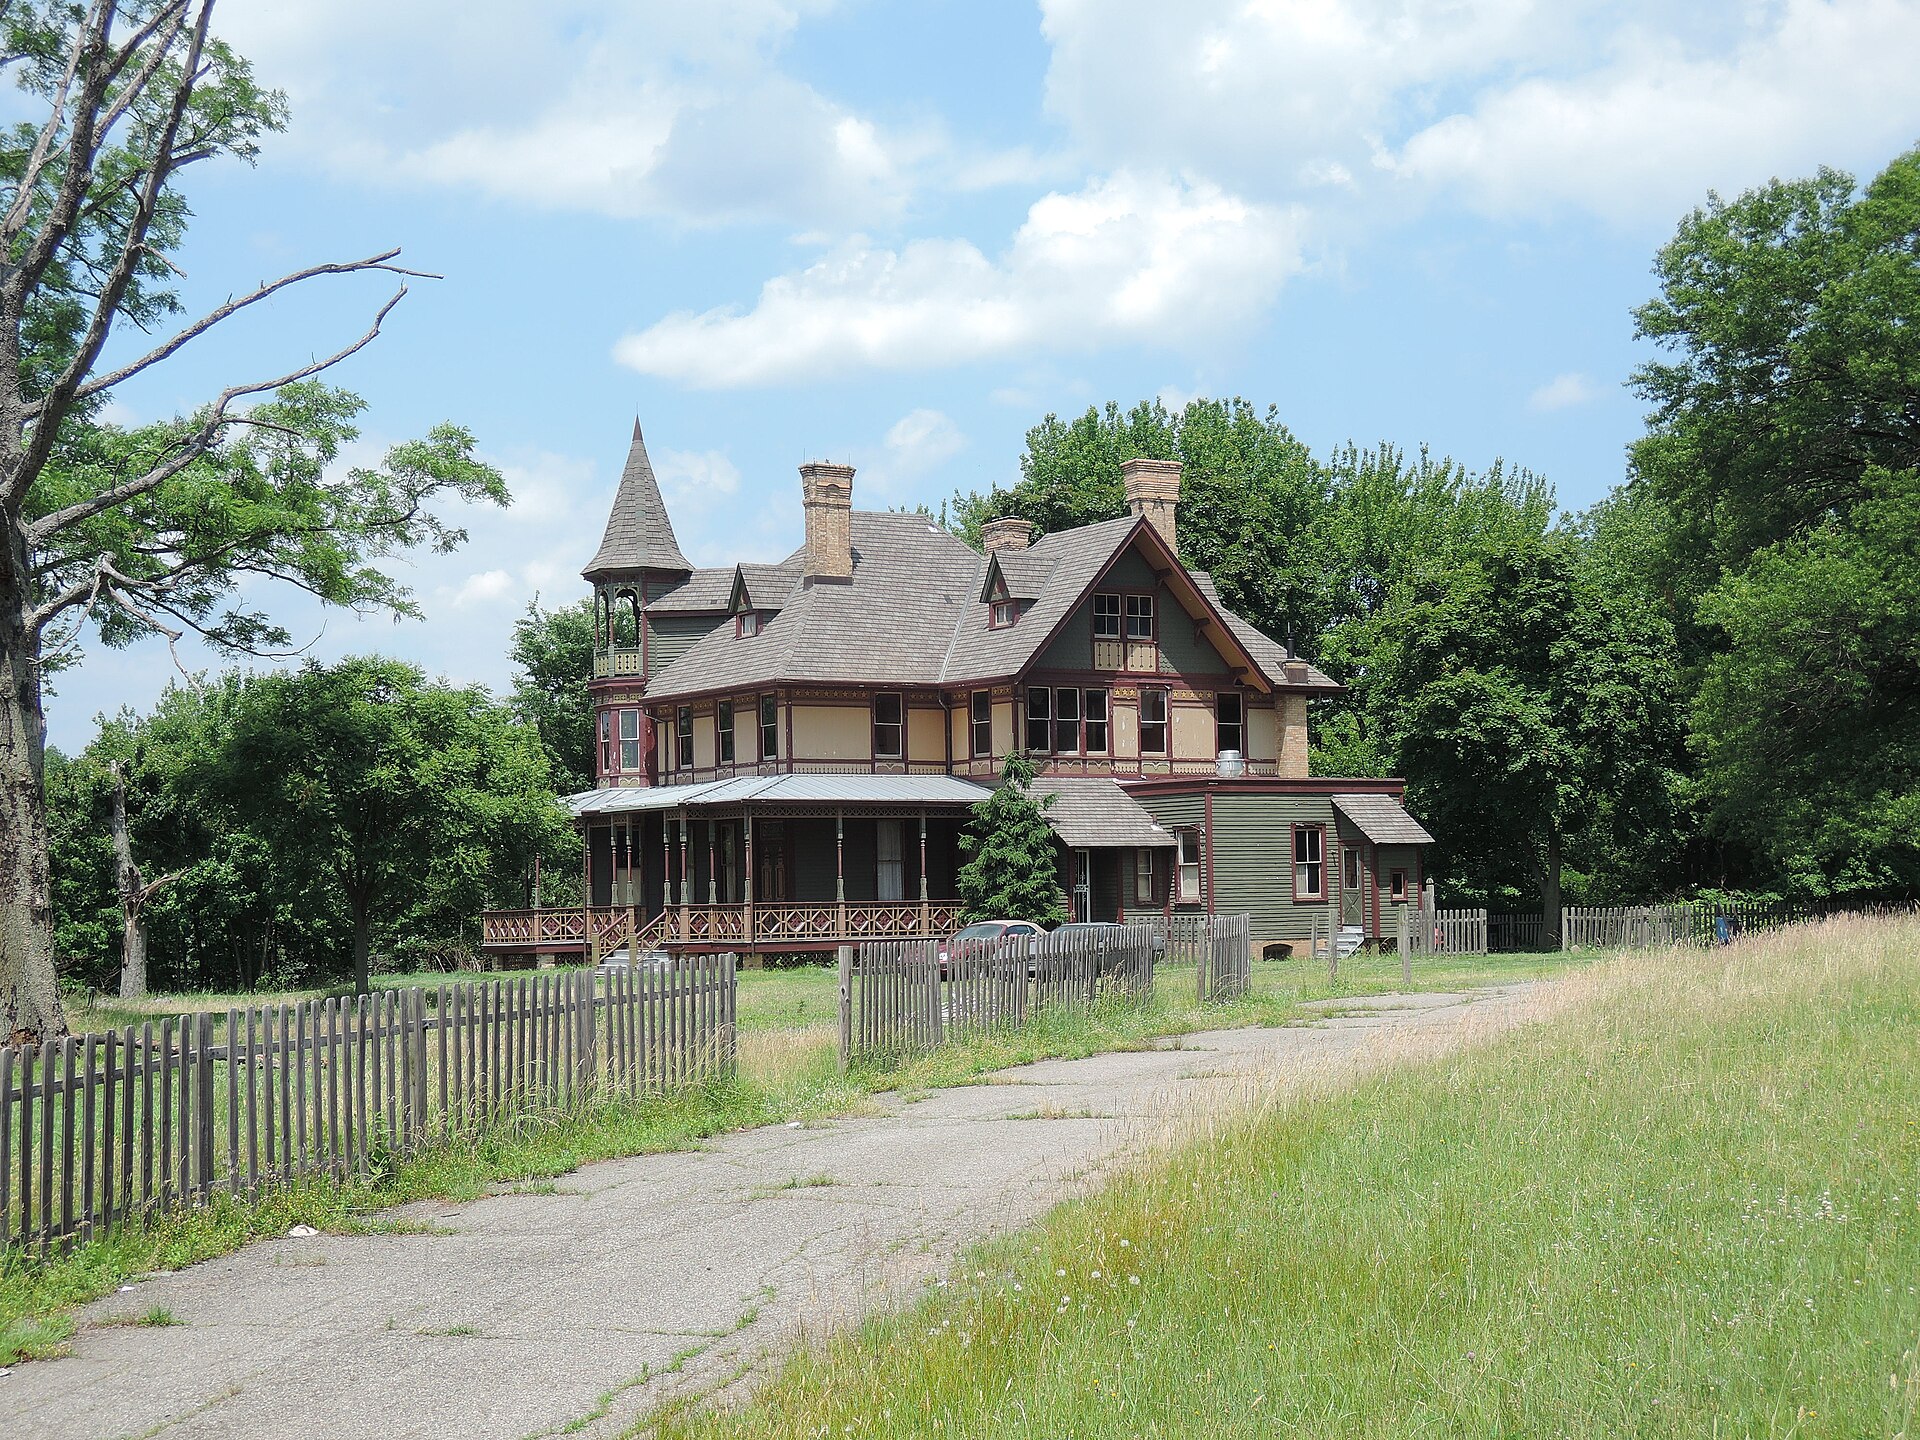
Kreischer House Uncut, Tottenville-Charleston You checked the neighborhood.Now check an address ! Photo: Jim.henderson, CC0 · Wikimedia Commons

For $34.00 a CrimesLog™ Home Report provides: (where available)

  • Nearest 6 Pre-school Nurseries to Address
  • Nearest 6 Primary Schools to Address
  • Nearest 6 Secondary/High Schools to Address
  • Nearest College and University to Address
  • Nearest to Address Medical Clinics, Hospitals and Pharmacies
  • Nearest 2 Police Station details to Address

The Home Report also provides

  • The CrimesLog™ Home Score is a proprietary Home Safety Measure capturing crime frequency, severity, recency and proximity to Address from police crime reporting point
  • A map indicating police anonymized crime reporting points around Address
  • Crime category trendlines for Address neighborhood
  • List of Reported Crime Incidents around Address radius
  • Downloadable PDF report — A Permanent Copy to Keep and Share to aid your Property Research
  • Our crimes database of almost 60 million records is UPDATED EVERY MONTH from US, UK, CA police sources
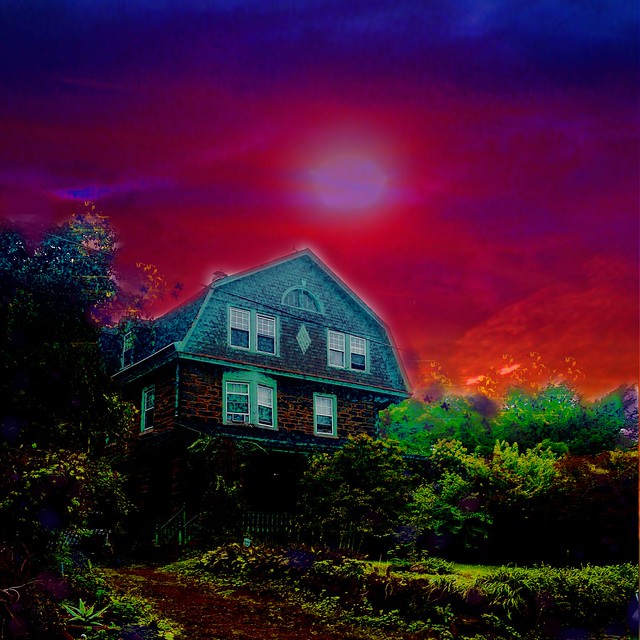
East Oak Lane Twilight, East Oak Lane
East Oak Lane · East Oak Lane Twilight
Photo: brillianthues, CC BY 2.0 · Flickr
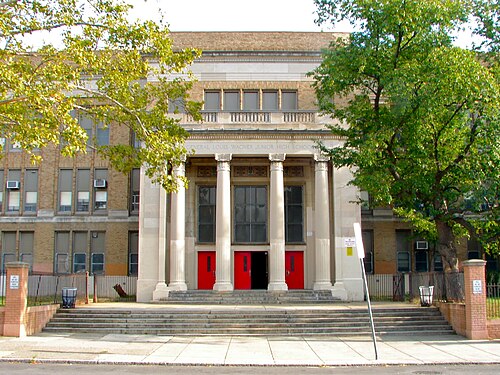
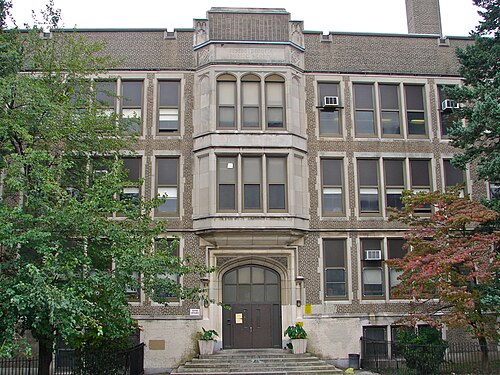
Wagner Jr HS Philly, West Oak Lane
West Oak Lane · Wagner Jr HS Philly
Photo: Smallbones, Public domain · Wikimedia Commons
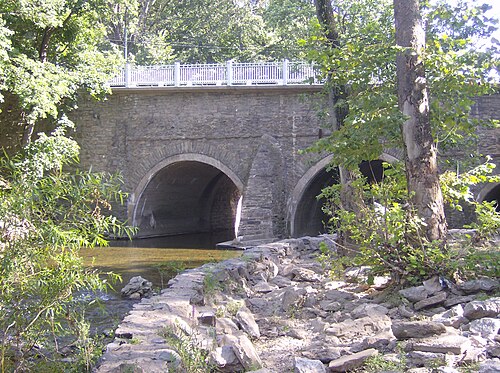
Frankford-Avenue-Bridge, Fox Chase
Fox Chase · Frankford-Avenue-Bridge
Photo: The original uploader was Coemgenus at English Wikipedia., Public domain · Wikimedia Commons
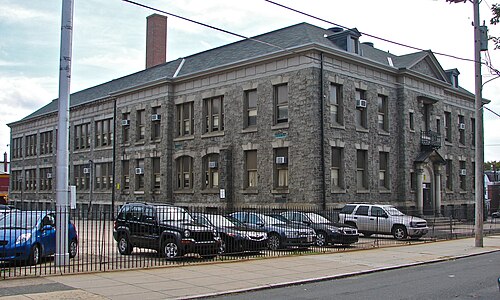
Olney Elementary Philly, Olney
Olney · Olney Elementary Philly
Photo: Smallbones, Public domain · Wikimedia Commons
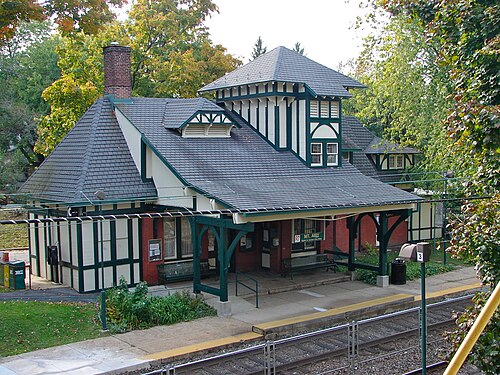
Mt Airy Station, Mount Airy, East
Mount Airy, East · Mt Airy Station
Photo: Smallbones, Public domain · Wikimedia Commons
Howe School Philly B, Fern Rock
Fern Rock · Howe School Philly B
Photo: Smallbones, Public domain · Wikimedia Commons
Pennel School Philly, Ogontz
Ogontz · Pennel School Philly
Photo: Smallbones, Public domain · Wikimedia Commons
Frank Synogue Philly, Logan
Logan · Frank Synogue Philly
Photo: Smallbones, Public domain · Wikimedia Commons

How neighborhoods moved each quarter

2022

Whole-area crime rate 16.5 to 19.8 per 1,000 (high: Q3 2022).

Big moves (4+ places in a quarter): moved up Summerdale 12th→3rd (Q2) moved down Melrose Park Gardens 1st→5th (Q2) moved down East Oak Lane 6th→10th (Q3) moved up East Oak Lane 10th→5th (Q4)

2023

Whole-area crime rate 19.7 to 22.6 per 1,000 (high: Q3 2023).

Big moves (4+ places in a quarter): moved up Fox Chase 7th→2nd (Q1) moved up Oxford Circle 8th→4th (Q1) moved down Melrose Park Gardens 2nd→6th (Q1) moved up Rhawnhurst 12th→7th (Q1) moved down Summerdale 3rd→10th (Q1) moved up East Oak Lane 8th→2nd (Q2) moved down Burholme 1st→6th (Q2) moved down Rhawnhurst 7th→11th (Q2) moved up Mount Airy, East 8th→4th (Q3) moved up Olney 12th→8th (Q3) moved down Melrose Park Gardens 5th→10th (Q3) moved up Melrose Park Gardens 10th→4th (Q4) moved down East Oak Lane 2nd→6th (Q4)

2024

Whole-area crime rate 17.2 to 20.8 per 1,000 (high: Q3 2024).

Big moves (4+ places in a quarter): moved up Olney 9th→5th (Q1) moved down Burholme 3rd→12th (Q1) moved down Olney 5th→9th (Q2) moved up Summerdale 8th→3rd (Q3) moved up Burholme 10th→4th (Q3) moved up West Oak Lane 9th→5th (Q4) moved down Burholme 4th→9th (Q4)

2025

Whole-area crime rate 15.5 to 20.2 per 1,000 (high: Q3 2025).

Big moves (4+ places in a quarter): moved down Melrose Park Gardens 2nd→7th (Q1) moved up Melrose Park Gardens 7th→1st (Q2) moved up Burholme 6th→2nd (Q2) moved down Cedarbrook 1st→9th (Q2) moved up Summerdale 7th→2nd (Q3) moved up Cedarbrook 9th→5th (Q3) moved down East Oak Lane 4th→8th (Q3) moved up Germantown, East 16th→11th (Q3) moved up East Oak Lane 8th→4th (Q4) moved down Melrose Park Gardens 3rd→8th (Q4)

2026

Whole-area crime rate 14.6 to 19.4 per 1,000 (high: Q2 2026). 2 quarters so far.

Big moves (4+ places in a quarter): moved up Fox Chase 7th→3rd (Q1) moved up Melrose Park Gardens 11th→2nd (Q2) moved down Fox Chase 3rd→7th (Q2) moved down Summerdale 2nd→9th (Q2) moved up Fern Rock 15th→11th (Q2)

Reported Safety Incidents

In Q2 2026: property incidents were 47% (2,858), violent incidents were 26% (1,618), vehicle crimes were 19% (1,144) and public order incidents were 0% (29).

Recorded crime here is grouped into violent crime, property crime (burglary and theft), vehicle crime and public order offences, so you can compare how safe each neighborhood is for the kind of crime that matters to you.

Read category comparisons with care. A category that jumps while the total hardly moves looks like a change in how offences are classified, not in what happened: Q3 2022: vehicle up 44% while the total moved 7%; Q4 2022: vehicle up 25% while the total moved 1%. The whole-area rate is the steadier guide.

Places we left out, and places to read with care

No place is left out: every neighborhood in this race has residents to count.

Crescentville (202.1 per 1,000 from 98 crimes among 485 residents) is a place with few residents (under 3,000): a rate on so few people says little about living there, so it is not named as the lowest or highest.

The 17 neighborhoods on the map

North is made of 17 neighborhoods compared here, each in its own colour on the map. They are the neighborhoods of OpenDataPhilly (Robert Cheetham, CC BY), grouped into areas of the city by CrimesLog: 315,693 residents between them.

  • Burholme
  • Cedarbrook
  • Crescentville
  • East Oak Lane
  • Fern Rock
  • Fox Chase
  • Germantown, East
  • Lawndale
  • Logan
  • Melrose Park Gardens
  • Mount Airy, East
  • Ogontz
  • Olney
  • Oxford Circle
  • Rhawnhurst
  • Summerdale
  • West Oak Lane

All 17 neighborhoods, Q2 2026

Crimes per 1,000 residents, Q2 2026, lowest first. The last two columns compare with Q1 2022.
#NeighborhoodResidentsAllViolentPropertyVehiclePublic orderRate vs Q1 2022Places gained
1Burholme4,58710.92.64.43.50.0down2%up2
2Melrose Park Gardens3,98513.82.57.03.50.0up49%down1
3East Oak Lane10,77214.83.66.83.70.0up17%up2
4Cedarbrook12,10115.04.95.53.00.1up54%down2
5West Oak Lane40,90615.34.36.33.60.0up8%up2
6Oxford Circle51,18915.43.87.13.90.0up10%–
7Fox Chase20,77715.42.57.83.40.0up37%down3
8Olney39,80216.25.06.53.50.3up6%up2
9Summerdale8,35116.55.06.73.40.1up4%up3
10Mount Airy, East18,42619.65.97.54.30.2up31%down1
11Fern Rock5,64019.77.37.32.50.0down39%up4
12Rhawnhurst27,74621.83.213.83.50.0up48%down4
13Ogontz14,33122.58.78.92.70.3up24%–
14Germantown, East12,37928.310.19.13.50.2up19%–
15Lawndale23,52129.24.320.82.90.0up84%down4
16Logan20,69530.310.810.95.20.2down11%–
17Crescentville †485202.151.5113.422.70.0up2%–

† Crescentville is a place with few residents. A rate on a very small number of residents or crimes is not comparable with the others.

Photographs

26 photographs of the 17 neighborhoods run along the reel; click one to see it full size. Each is credited here and under the large view.

All 26 photographs and their credits
  1. East Oak Lane · East Oak Lane Twilight. Photo: brillianthues, CC BY 2.0 · Flickr
  2. West Oak Lane · Wagner Jr HS Philly. Photo: Smallbones, Public domain · Wikimedia Commons
  3. Fox Chase · Frankford-Avenue-Bridge. Photo: The original uploader was Coemgenus at English Wikipedia., Public domain · Wikimedia Commons
  4. Olney · Olney Elementary Philly. Photo: Smallbones, Public domain · Wikimedia Commons
  5. Mount Airy, East · Mt Airy Station. Photo: Smallbones, Public domain · Wikimedia Commons
  6. Fern Rock · Howe School Philly B. Photo: Smallbones, Public domain · Wikimedia Commons
  7. Ogontz · Pennel School Philly. Photo: Smallbones, Public domain · Wikimedia Commons
  8. Logan · Frank Synogue Philly. Photo: Smallbones, Public domain · Wikimedia Commons
  9. West Oak Lane · Ogontz Hall Philly. Photo: Smallbones, Public domain · Wikimedia Commons
  10. Fox Chase · Kennedy Crossan School Philly. Photo: Smallbones, Public domain · Wikimedia Commons
  11. Olney · Finletter School Philly. Photo: Smallbones, Public domain · Wikimedia Commons
  12. Mount Airy, East · EC Emlen School Philly. Photo: Smallbones, Public domain · Wikimedia Commons
  13. Fern Rock · Howe School Philly A. Photo: Smallbones, Public domain · Wikimedia Commons
  14. Ogontz · Suffolk Manor Philly. Photo: Smallbones, Public domain · Wikimedia Commons
  15. Logan · Birney School Philly B. Photo: Smallbones, Public domain · Wikimedia Commons
  16. West Oak Lane · Kinsey School Philly. Photo: Smallbones, Public domain · Wikimedia Commons
  17. Olney · JR Lowell School Philly. Photo: Smallbones, Public domain · Wikimedia Commons
  18. Mount Airy, East · Cliveden Markers Germantown Avenue 2026-06-19. Photo: Kreuz und quer, CC0 · Wikimedia Commons
  19. Fern Rock · Fern Rock Theater, 1928-92, 6017 North Fifth Street, Philadelphia. Photo: Scavenger49, CC BY 2.0 · Flickr
  20. West Oak Lane · Rowen School Philly. Photo: Smallbones, Public domain · Wikimedia Commons
  21. Olney · Olney HS Philly. Photo: Smallbones, Public domain · Wikimedia Commons
  22. Mount Airy, East · Grace Epiphany Mt Airy. Photo: Smallbones, Public domain · Wikimedia Commons
  23. Fern Rock · Fern Rock Theater 1928-92, 6017 North Fifth Street, Philadelphia. Photo: Scavenger49, CC BY 2.0 · Flickr
  24. Olney · Morrison School Philly. Photo: Smallbones, Public domain · Wikimedia Commons
  25. Olney · Phila Broad Street Subway Olney Station 1. Photo: Goosefriend, CC BY 2.0 · Flickr
  26. Olney · Colney Theater 1925-58, 5721 North Fifth Street, Philadelphia. Photo: Scavenger49, CC BY 2.0 · Flickr

Sources and notes

CrimesLog sources crime incident data published by the Philadelphia Police Department (PPD) through the City of Philadelphia Open Data Portal (OpenDataPhilly), containing public sector information released under a Creative Commons CC0 1.0 Universal public domain dedication.

Population: U.S. Census Bureau, American Community Survey 5-year estimates (public domain).

First-place medal: 1st Place Medal emoji icon by Icons8.

Neighborhood boundaries are defined by OpenDataPhilly / Robert Cheetham (CC BY), grouped into areas of the city by CrimesLog and simplified by CrimesLog. The photographs are credited under each picture.

Rates are recorded crimes per 1,000 residents, quarter by quarter; where a neighborhood has fewer than 100 residents the rate would be worked out on 100 (those places are left out of the race). A count of recorded crime is not a verdict on any neighborhood.