London · Neighbourhood crime trends

London Brent

24 neighbourhoods - a quarterly race to the lowest crime rate.

Crime Trends: Neighbourhoods compared - each quarter from Q1 2023

London as a whole averaged 28.0 crimes for every 1,000 residents per quarter in Q2 2026, while Brent averaged 27.4, hence it is generally about as safe as London as a whole when all crimes are considered.

How do the 24 neighbourhoods of Brent compare? In Q2 2026 the police recorded 9,309 crimes across them, 27.4 for every 1,000 residents. That is 1.8% above a year earlier and 21.0% above Q1 2023, the first quarter we track.

South Kenton has the lowest rate of the everyday neighbourhoods (10.7 per 1,000), followed by Preston Road (13.1) and Kensal Rise (15.6). Brondesbury has the highest (57.3).

Use the RACE CHARTS below to watch all 24 LONDON BRENT NEIGHBOURHOODs race across 14 quarter periods from Q1 2023 to Q2 2026 - one crime category at a time or all together. The race chart can be used to compare average crime rates by category against London's average.

Neighbourhood areas derived by CrimesLog from rail station locations (NaPTAN, Department for Transport) and OS Open Names. Contains OS data © Crown copyright and database right 2024; contains public sector information licensed under the Open Government Licence v3.0.
Lowest rate (everyday)
lowest rateSouth Kenton
10.7 crimes per 1,000 residents, Q2 2026
Highest rate
upBrondesbury
57.3 per 1,000, Q2 2026
Whole area, Q2 2026
27.4 per 1,000
up 1.8% above a year earlier · up 21.0% above Q1 2023
Compared
24 neighbourhoods
339,211 residents · 14 quarters

London Brent neighbourhood quarterly crime race

Press ▶︎ to watch Q1 2023 to Q2 2026. Tick one crime category or several; hover a bar for the neighbourhood. Property crimes includes burglaries and thefts.

Crime categories
Indicated: crimes rate per 1000 residents per quarterAll · safest at the top · square-root scale · Q1 2023 to Q2 202601510255015.3Alperton26.6Brent Cross West41.9Brondesbury26.8Brondesbury Park19.6Dollis Hill24.1Harlesden28.7Kensal Green16.6Kensal Rise20.1Kilburn Park16.9Kingsbury31.9Neasden14.5North Wembley39.1Northwick Park11.3Preston Road8.0South Kenton20.8Stonebridge Park16.4Sudbury7.5Wembley28.1Wembley Central26.4Wembley Park18.1Wembley Stadium22.2Willesden Green51.3Willesden Junction21.2Willesden Junction Low LevelLondon Q2 2026 average all crimes (28.0)Numbers are crimes per 1,000 residents per quarter. Zero-crime quarters show 0 and rank safest.
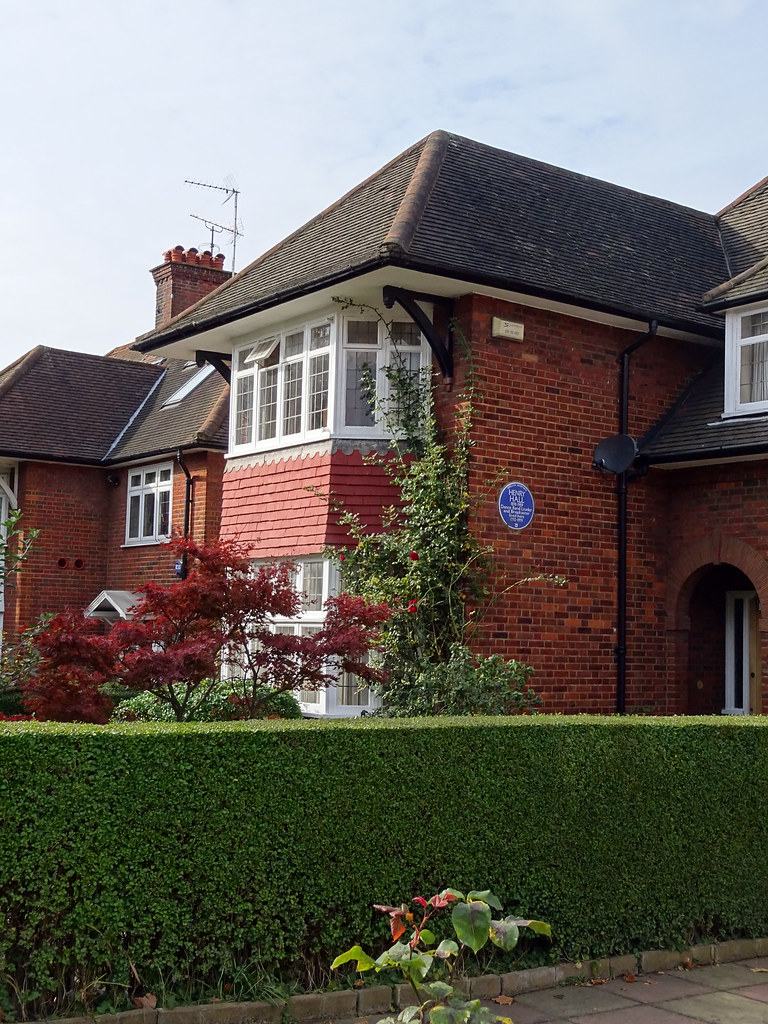
HENRY HALL - 38 Harman Drive Cricklewood London NW2 2ED, Cricklewood You checked the neighbourhood.Now check an address ! Photo: Spudgun67, CC BY 2.0 · Flickr

For £24.99 a CrimesLog™ Home Report provides: (where available)

  • Nearest 6 Pre-school Nurseries to Address
  • Nearest 6 Primary Schools to Address
  • Nearest 6 Secondary/High Schools to Address
  • Nearest College and University to Address
  • Nearest to Address GP Practice/Health Centres, Hospitals and Pharmacies
  • Nearest 2 Police Station details to Address

The Home Report also provides

  • The CrimesLog™ Home Score is a proprietary Home Safety Measure capturing crime frequency, severity, recency and proximity to Address from police crime reporting point
  • A map indicating police anonymised crime reporting points around Address
  • Crime category trendlines for Address neighbourhood
  • List of Reported Crime Incidents around Address radius
  • Downloadable PDF report — A Permanent Copy to Keep and Share to aid your Property Research
  • Our crimes database of almost 60 million records is UPDATED EVERY MONTH from US, UK, CA police sources
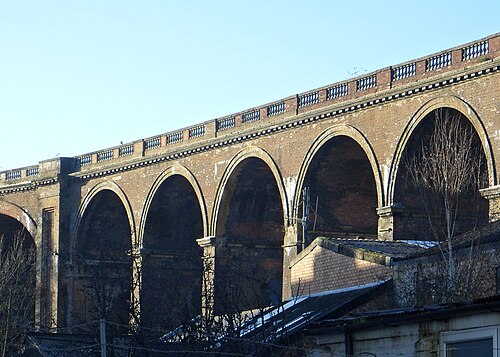
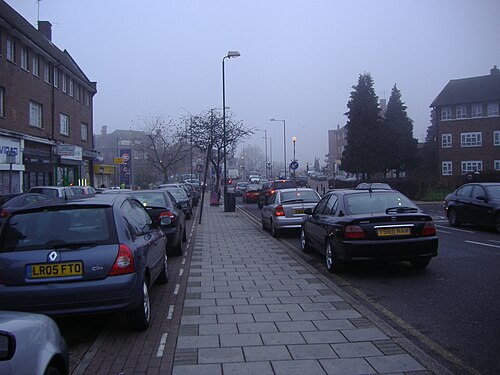
File:London Road Viaduct Seen from Preston Road, Brighton (Looking NNW) (December 2013).JPG, Preston Road
Preston Road · File:London Road Viaduct Seen from Preston Road, Brighton (Looking NNW) (December 2013).JPG
Photo: Hassocks5489, CC0 · Wikimedia Commons
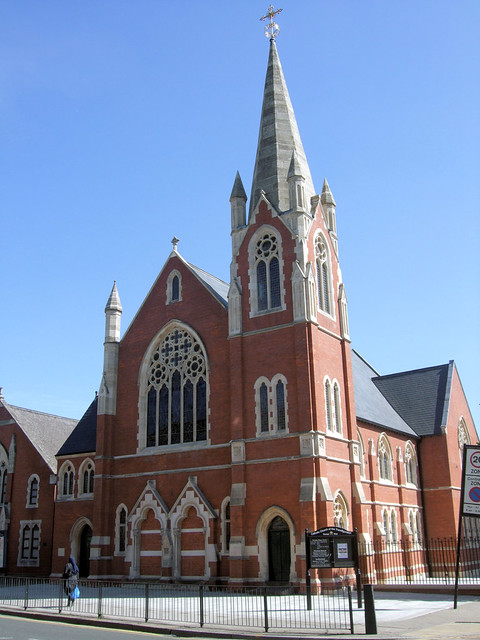
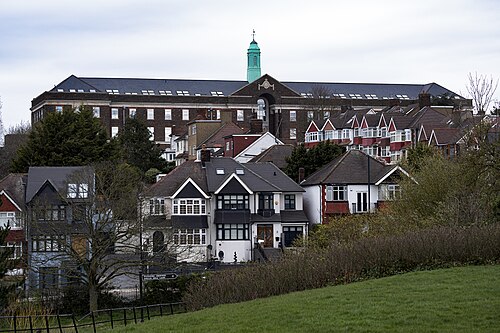
Tower Of The Catholic Church Of The Transfigoration, Kensal Rise - London., Kensal Rise
Kensal Rise · Tower Of The Catholic Church Of The Transfigoration, Kensal Rise - London.
Photo: Jim Linwood, CC BY 2.0 · Flickr
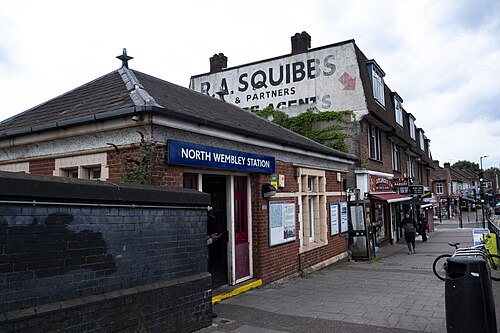
North Wembley Station, North Wembley
North Wembley · North Wembley Station
Photo: Simon from London, United Kingdom, CC BY 2.0 · Wikimedia Commons
Church Lane1, Kingsbury
Kingsbury · Church Lane1
Photo: David Howard, CC0 · Wikimedia Commons
Former GPO Research Station, Dollis Hill, Dollis Hill
Dollis Hill · Former GPO Research Station, Dollis Hill
Photo: London Less Travelled, CC BY 2.0 · Wikimedia Commons
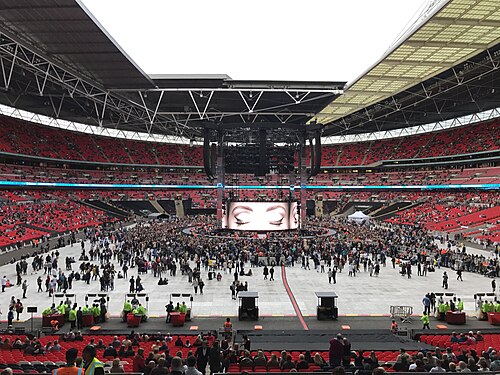
Adele Live 2017 - Inside WEMBLEY Stadium Before the Show - LONDON (Night 1), Stonebridge Park
Stonebridge Park · Adele Live 2017 - Inside WEMBLEY Stadium Before the Show - LONDON (Night 1)
Photo: Ungry Young Man, CC BY 2.0 · Wikimedia Commons
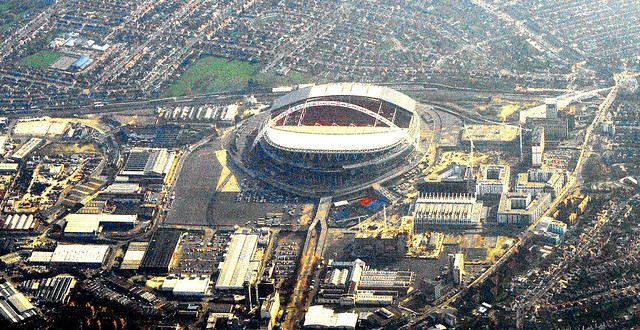
Wembley Stadium. London, Wembley Stadium
Wembley Stadium · Wembley Stadium. London
Photo: M McBey, CC BY 2.0 · Flickr
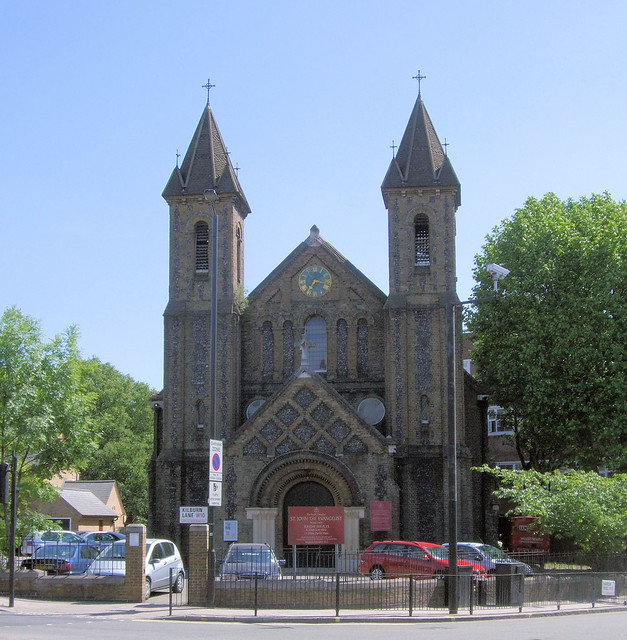
Saint John The Evangelist Church, Kensal Green - London., Kensal Green
Kensal Green · Saint John The Evangelist Church, Kensal Green - London.
Photo: Jim Linwood, CC BY 2.0 · Flickr

How neighbourhoods moved each quarter

2023

Whole-area crime rate 22.7 to 26.5 per 1,000 (high: Q3 2023).

Big moves (4+ places in a quarter): moved down Wembley Stadium 9th→14th (Q2) moved up Brent Cross West 18th→13th (Q3) moved up Brondesbury Park 15th→11th (Q4) moved up Harlesden 19th→13th (Q4) moved down Stonebridge Park 10th→14th (Q4) moved down Brent Cross West 13th→17th (Q4) moved down Wembley Park 17th→21st (Q4)

2024

Whole-area crime rate 25.7 to 27.2 per 1,000 (high: Q2 2024).

Big moves (4+ places in a quarter): moved up Stonebridge Park 14th→9th (Q1) moved down Brondesbury Park 11th→17th (Q1) moved up Brondesbury Park 17th→10th (Q2) moved down Stonebridge Park 9th→13th (Q2) moved up Stonebridge Park 13th→9th (Q3) moved down Kensal Rise 7th→11th (Q3) moved down Kensal Green 16th→20th (Q3) moved up Kensal Green 20th→15th (Q4)

2025

Whole-area crime rate 24.7 to 29.0 per 1,000 (high: Q3 2025).

Big moves (4+ places in a quarter): moved up Brondesbury Park 14th→9th (Q1) moved down Willesden Junction Low Level 5th→10th (Q1) moved down Stonebridge Park 11th→16th (Q1) moved down Harlesden 13th→17th (Q1) moved up Stonebridge Park 16th→11th (Q2) moved down Brondesbury Park 9th→13th (Q2) moved down Wembley 1st→7th (Q3) moved up Dollis Hill 15th→11th (Q3) moved down Kensal Green 14th→19th (Q3) moved up Wembley 7th→2nd (Q4) moved up Wembley Stadium 20th→16th (Q4) moved down Stonebridge Park 14th→18th (Q4)

2026

Whole-area crime rate 24.9 to 27.4 per 1,000 (high: Q2 2026). 2 quarters so far.

Big moves (4+ places in a quarter): moved up Alperton 13th→8th (Q1) moved up Wembley Stadium 16th→9th (Q1) moved up Kensal Green 17th→10th (Q1) moved up Stonebridge Park 18th→11th (Q1) moved down Willesden Junction Low Level 8th→13th (Q1) moved down Kilburn Park 10th→15th (Q1) moved down Brondesbury Park 9th→16th (Q1) moved down Brent Cross West 14th→18th (Q1) moved down Wembley 1st→5th (Q2) moved up Willesden Junction Low Level 13th→8th (Q2) moved up Kilburn Park 15th→9th (Q2) moved down Wembley Stadium 9th→14th (Q2) moved down Kensal Green 10th→15th (Q2) moved down Brondesbury Park 16th→21st (Q2)

Reported Safety Incidents

In Q2 2026: violent incidents were 37% (3,438), public order incidents were 28% (2,615), property incidents were 27% (2,534) and vehicle crimes were 8% (722).

Recorded crime here is grouped into violent crime, property crime (burglary and theft), vehicle crime and public order offences, so you can compare how safe each neighbourhood is for the kind of crime that matters to you.

Places we left out, and places to read with care

No place is left out: every neighbourhood in this race has residents to count.

Wembley (17.6 per 1,000 from 7 crimes among 398 residents) is a place with few residents (under 3,000): a rate on so few people says little about living there, so it is not named as the lowest or highest.

The 24 neighbourhoods on the map

Brent is made of 24 neighbourhoods compared here, each in its own colour on the map. They are neighbourhood areas derived by CrimesLog from rail station locations and OS Open Names: 339,211 residents between them.

  • Alperton
  • Brent Cross West
  • Brondesbury
  • Brondesbury Park
  • Dollis Hill
  • Harlesden
  • Kensal Green
  • Kensal Rise
  • Kilburn Park
  • Kingsbury
  • Neasden
  • North Wembley
  • Northwick Park
  • Preston Road
  • South Kenton
  • Stonebridge Park
  • Sudbury
  • Wembley
  • Wembley Central
  • Wembley Park
  • Wembley Stadium
  • Willesden Green
  • Willesden Junction
  • Willesden Junction Low Level

All 24 neighbourhoods, Q2 2026

Crimes per 1,000 residents, Q2 2026, lowest first. The last two columns compare with Q1 2023.
#NeighbourhoodResidentsAllViolentPropertyVehiclePublic orderRate vs Q1 2023Places gained
1South Kenton9,10710.74.62.01.42.6up33%up1
2Preston Road12,21413.15.22.50.84.5up16%up1
3Kensal Rise16,08915.65.23.52.54.4down6%up4
4North Wembley12,29915.66.53.60.84.7up8%–
5Wembley †39817.612.60.00.05.0up133%down4
6Sudbury9,44418.05.85.60.65.9up10%–
7Kingsbury22,82119.57.45.02.44.7up15%up1
8Willesden Junction Low Level5,81221.78.34.73.15.7up2%up5
9Kilburn Park17,49623.98.66.21.97.2up19%up2
10Alperton21,04724.09.27.41.55.8up57%down5
11Dollis Hill19,78426.610.15.12.78.7up36%down1
12Stonebridge Park14,79726.79.45.53.58.3up28%–
13Willesden Green16,95926.78.87.52.48.0up20%up1
14Wembley Stadium17,05828.411.57.51.48.1up57%down5
15Kensal Green12,51128.98.18.93.08.9up1%up5
16Brent Cross West14,47731.011.37.53.38.9up17%up1
17Neasden24,85931.313.17.32.68.3down2%up4
18Harlesden20,56031.513.55.13.29.7up31%down3
19Wembley Park27,66732.112.19.21.39.5up22%down3
20Wembley Central17,06935.014.711.01.38.0up25%down1
21Brondesbury Park7,95436.85.723.31.06.9up38%down3
22Northwick Park3,11653.628.210.32.612.5up37%–
23Willesden Junction8,55257.220.616.53.716.4up11%up1
24Brondesbury7,12157.314.025.62.015.7up37%down1

† Wembley is a place with few residents. A rate on a very small number of residents or crimes is not comparable with the others.

Photographs

51 photographs of the 24 neighbourhoods run along the reel; click one to see it full size. Each is credited here and under the large view.

All 51 photographs and their credits
  1. Preston Road · File:London Road Viaduct Seen from Preston Road, Brighton (Looking NNW) (December 2013).JPG. Photo: Hassocks5489, CC0 · Wikimedia Commons
  2. Kensal Rise · Tower Of The Catholic Church Of The Transfigoration, Kensal Rise - London.. Photo: Jim Linwood, CC BY 2.0 · Flickr
  3. North Wembley · North Wembley Station. Photo: Simon from London, United Kingdom, CC BY 2.0 · Wikimedia Commons
  4. Kingsbury · Church Lane1. Photo: David Howard, CC0 · Wikimedia Commons
  5. Dollis Hill · Former GPO Research Station, Dollis Hill. Photo: London Less Travelled, CC BY 2.0 · Wikimedia Commons
  6. Stonebridge Park · Adele Live 2017 - Inside WEMBLEY Stadium Before the Show - LONDON (Night 1). Photo: Ungry Young Man, CC BY 2.0 · Wikimedia Commons
  7. Wembley Stadium · Wembley Stadium. London. Photo: M McBey, CC BY 2.0 · Flickr
  8. Kensal Green · Saint John The Evangelist Church, Kensal Green - London.. Photo: Jim Linwood, CC BY 2.0 · Flickr
  9. Brent Cross West · Ox and Gate Pub. Photo: David Howard, CC BY 2.0 · Wikimedia Commons
  10. Neasden · Neasden - Aboyne Road, Wykeham Primary School (1). Photo: Romainbehar, CC0 · Wikimedia Commons
  11. Harlesden · Harlesden Station. Photo: Matt From London, CC BY 2.0 · Flickr
  12. Wembley Park · Wembley Park Underground at Night. Photo: Drew de F Fawkes, CC BY 2.0 · Flickr
  13. Wembley Central · Wembley Central Station. Photo: markhillary, CC BY 2.0 · Flickr
  14. Brondesbury Park · Chapel Paddington Cementry. Photo: Oxyman, CC BY 2.5 · Wikimedia Commons
  15. Northwick Park · Northwick Park Hospital. Photo: Simon from London, United Kingdom, CC BY 2.0 · Wikimedia Commons
  16. Brondesbury · A London Success Story- the Overground.. Photo: Roger Carvell, CC BY 3.0 · Wikimedia Commons
  17. Cricklewood · HENRY HALL - 38 Harman Drive Cricklewood London NW2 2ED. Photo: Spudgun67, CC BY 2.0 · Flickr
  18. Kilburn · Former Gaumont State Cinema, Kilburn High Road, London.. Photo: Jim Linwood, CC BY 2.0 · Flickr
  19. Kilburn High Road · Gaumont State Cinema Tower, Kilburn High Road, London. Photo: Jim Linwood, CC BY 2.0 · Wikimedia Commons
  20. Preston Road · London Road Railway Viaduct Seen from Preston Road, Brighton (April 2009). Photo: Hassocks5489, CC0 · Wikimedia Commons
  21. Kensal Rise · London, Church, Kensal Rise. Photo: j_silla, CC BY 2.0 · Flickr
  22. Kingsbury · Coniston Gardens Und Wembley Stadium 2009. Photo: David Howard, CC0 · Wikimedia Commons
  23. Stonebridge Park · Neasden Temple - Shree Swaminarayan Hindu Mandir - Power Plant. Photo: CGP Grey, CC BY 2.0 · Wikimedia Commons
  24. Wembley Stadium · Wembley Stadium, London. Photo: Ian Wilson from London, England, CC BY 2.0 · Wikimedia Commons
  25. Kensal Green · Kensal Green. Photo: satguru, CC BY 2.0 · Flickr
  26. Neasden · Neasden - Aboyne Road, Wykeham Primary School (2). Photo: Romainbehar, CC0 · Wikimedia Commons
  27. Harlesden · College Park Hotel. Photo: It's No Game, CC BY 2.0 · Flickr
  28. Wembley Park · A Stock Farewell Railtour at Wembley Park. Photo: interbeat, CC BY 2.0 · Flickr
  29. Northwick Park · Harrow on the Hill from Northwick Park. Photo: London Less Travelled, CC BY 2.0 · Flickr
  30. Cricklewood · Sir Hersch Lauterpacht - 103 Walm Lane Cricklewood London NW2 4QG. Photo: Spudgun67, CC BY 2.0 · Flickr
  31. Kilburn · Kilburn Park Tube Station. Photo: It's No Game, CC BY 2.0 · Flickr
  32. Kilburn High Road · State Cinema on Kilburn High Road. Photo: Lars Born, CC BY 2.0 · Flickr
  33. Preston Road · London Road Railway Viaduct Seen from Preston Road, Brighton (September 2011) (3). Photo: Hassocks5489, CC0 · Wikimedia Commons
  34. Kensal Rise · New Life Bible Presbyterian Church, 44 Salusbury Road, Kensal Rise, London N.W.6 (June 2021) (2). Photo: User:Hassocks5489, CC0 · Wikimedia Commons
  35. Kingsbury · Coniston Gardens 2009. Photo: David Howard, CC0 · Wikimedia Commons
  36. Stonebridge Park · Neasden Temple - Shree Swaminarayan Hindu Mandir. Photo: CGP Grey, CC BY 2.0 · Wikimedia Commons
  37. Wembley Stadium · Wembley Stadium - London 2012 Olympic Football - South Korea V Gabon. Photo: interbeat, CC BY 2.0 · Flickr
  38. Kensal Green · Hazel Road Open Space. Photo: It's No Game, CC BY 2.0 · Flickr
  39. Neasden · Neasden - Aboyne Road, Wykeham Primary School (3). Photo: Romainbehar, CC0 · Wikimedia Commons
  40. Harlesden · Harlesden Town Centre. Photo: Matt From London, CC BY 2.0 · Flickr
  41. Kensal Rise · The Camberlayne Pub, Kensal Rise - London.. Photo: Jim Linwood, CC BY 2.0 · Flickr
  42. Kingsbury · St Andrews, Kingsbury. Photo: Matt From London, CC BY 2.0 · Flickr
  43. Stonebridge Park · Neasden Temple - Shree Swaminarayan Hindu Mandir. Photo: CGP Grey, CC BY 2.0 · Wikimedia Commons
  44. Kensal Green · Kensal Green. Photo: It's No Game, CC BY 2.0 · Flickr
  45. Neasden · Hindu Temple, Neasden, London. Photo: DavideGorla, CC BY 2.0 · Flickr
  46. Kensal Rise · Kensal Rise Baptist Tabernacle, Buller Road, Kensal Rise, London N.W.10 (June 2021) (1). Photo: User:Hassocks5489, CC0 · Wikimedia Commons
  47. Kingsbury · Kingsbury Station. Photo: satguru, CC0 · Flickr
  48. Kensal Green · Pub on Harrow Road, Kensal Green, London 2. Photo: Rc1959, CC0 · Wikimedia Commons
  49. Neasden · Hindu Temple, Neasden, London. Photo: DavideGorla, CC BY 2.0 · Flickr
  50. Kingsbury · Kingsbury Station. Photo: satguru, CC0 · Flickr
  51. Neasden · BAPS Shri Swaminarayan Mandir. Photo: markhillary, CC BY 2.0 · Flickr

Sources and notes

CrimesLog sources crime incident data as published by the UK Home Office through their national data portal at data.police.uk and licensed under their Open Government Licence v3.0. Reported crime incidents originate from individual Territorial Police Forces of England, Wales and Northern Ireland

Contains ONS data © Crown copyright and database right. Contains NISRA data © Crown copyright. Licensed under the Open Government Licence v3.0.

First-place medal: 1st Place Medal emoji icon by Icons8.

Neighbourhood areas derived by CrimesLog from rail station locations (NaPTAN, Department for Transport) and OS Open Names. Contains OS data © Crown copyright and database right 2024; contains public sector information licensed under the Open Government Licence v3.0. The photographs are credited under each picture.

Rates are recorded crimes per 1,000 residents, quarter by quarter; where a neighbourhood has fewer than 100 residents the rate would be worked out on 100 (those places are left out of the race). A count of recorded crime is not a verdict on any neighbourhood.