New York City · Neighborhood crime trends

New York Bronx North

21 neighborhoods - a quarterly race to the lowest crime rate.

Crime Trends: Neighborhoods compared - each quarter from Q1 2022

New York as a whole averaged 16.5 crimes for every 1,000 residents per quarter in Q2 2026, while the north Bronx averaged 20.6 (leaving out 4 places with almost no residents), hence it is generally less safe when all crimes are considered.

How do the 21 neighborhoods of the north Bronx compare? In Q2 2026 the police recorded 15,318 crimes across them, 20.6 for every 1,000 residents. That is 1.8% below a year earlier and 27.4% above Q1 2022, the first quarter we track.

Riverdale-Spuyten Duyvil has the lowest rate of the everyday neighborhoods (8.0 per 1,000), followed by Pelham Gardens (11.3) and Co-op City (13.1). Mount Hope has the highest (32.4).

Use the RACE CHARTS below to watch all 21 NEW YORK BRONX NORTH NEIGHBORHOODs race across 18 quarter periods from Q1 2022 to Q2 2026 - one crime category at a time or all together. The race chart can be used to compare average crime rates by category against New York's average.

Neighborhood boundaries are defined by NYC Department of City Planning, 2020 Neighborhood Tabulation Areas.
Lowest rate (everyday)
lowest rateRiverdale-Spuyten Duyvil
8.0 crimes per 1,000 residents, Q2 2026
Highest rate
upMount Hope
32.4 per 1,000, Q2 2026
Whole area, Q2 2026
20.6 per 1,000
down 1.8% below a year earlier · up 27.4% above Q1 2022
Compared
21 neighborhoods
743,880 residents · 18 quarters

New York Bronx North neighborhood quarterly crime race

Press ▶︎ to watch Q1 2022 to Q2 2026. Tick one crime category or several; hover a bar for the neighborhood. Property crimes includes burglaries and thefts.

Crime categories
Indicated: crimes rate per 1000 residents per quarterAll · safest at the top · square-root scale · Q1 2022 to Q2 2026015255010016.0Allerton11.3Bedford Park29.8Belmont8.4Co-op City16.1Eastchester-Edenwald-Baychester19.1Fordham Heights88.7Hutchinson Metro Center11.4Kingsbridge Heights-Van Cortlandt Village30.1Kingsbridge-Marble Hill13.3Morris Park20.8Mount Hope13.3Norwood149Pelham Bay Park12.0Pelham Gardens14.1Pelham Parkway-Van Nest6.9Riverdale-Spuyten Duyvil23.2Tremont18.7University Heights (North)-Fordham15.0University Heights (South)-Morris Heights16.9Wakefield-Woodlawn15.9Williamsbridge-OlinvilleNew York Q2 2026 average all crimes (16.5)Numbers are crimes per 1,000 residents per quarter. Zero-crime quarters show 0 and rank safest. Not included, no residents: Bronx Park; Hart Island; Van Cortlandt Park; Woodlawn Cemetery.
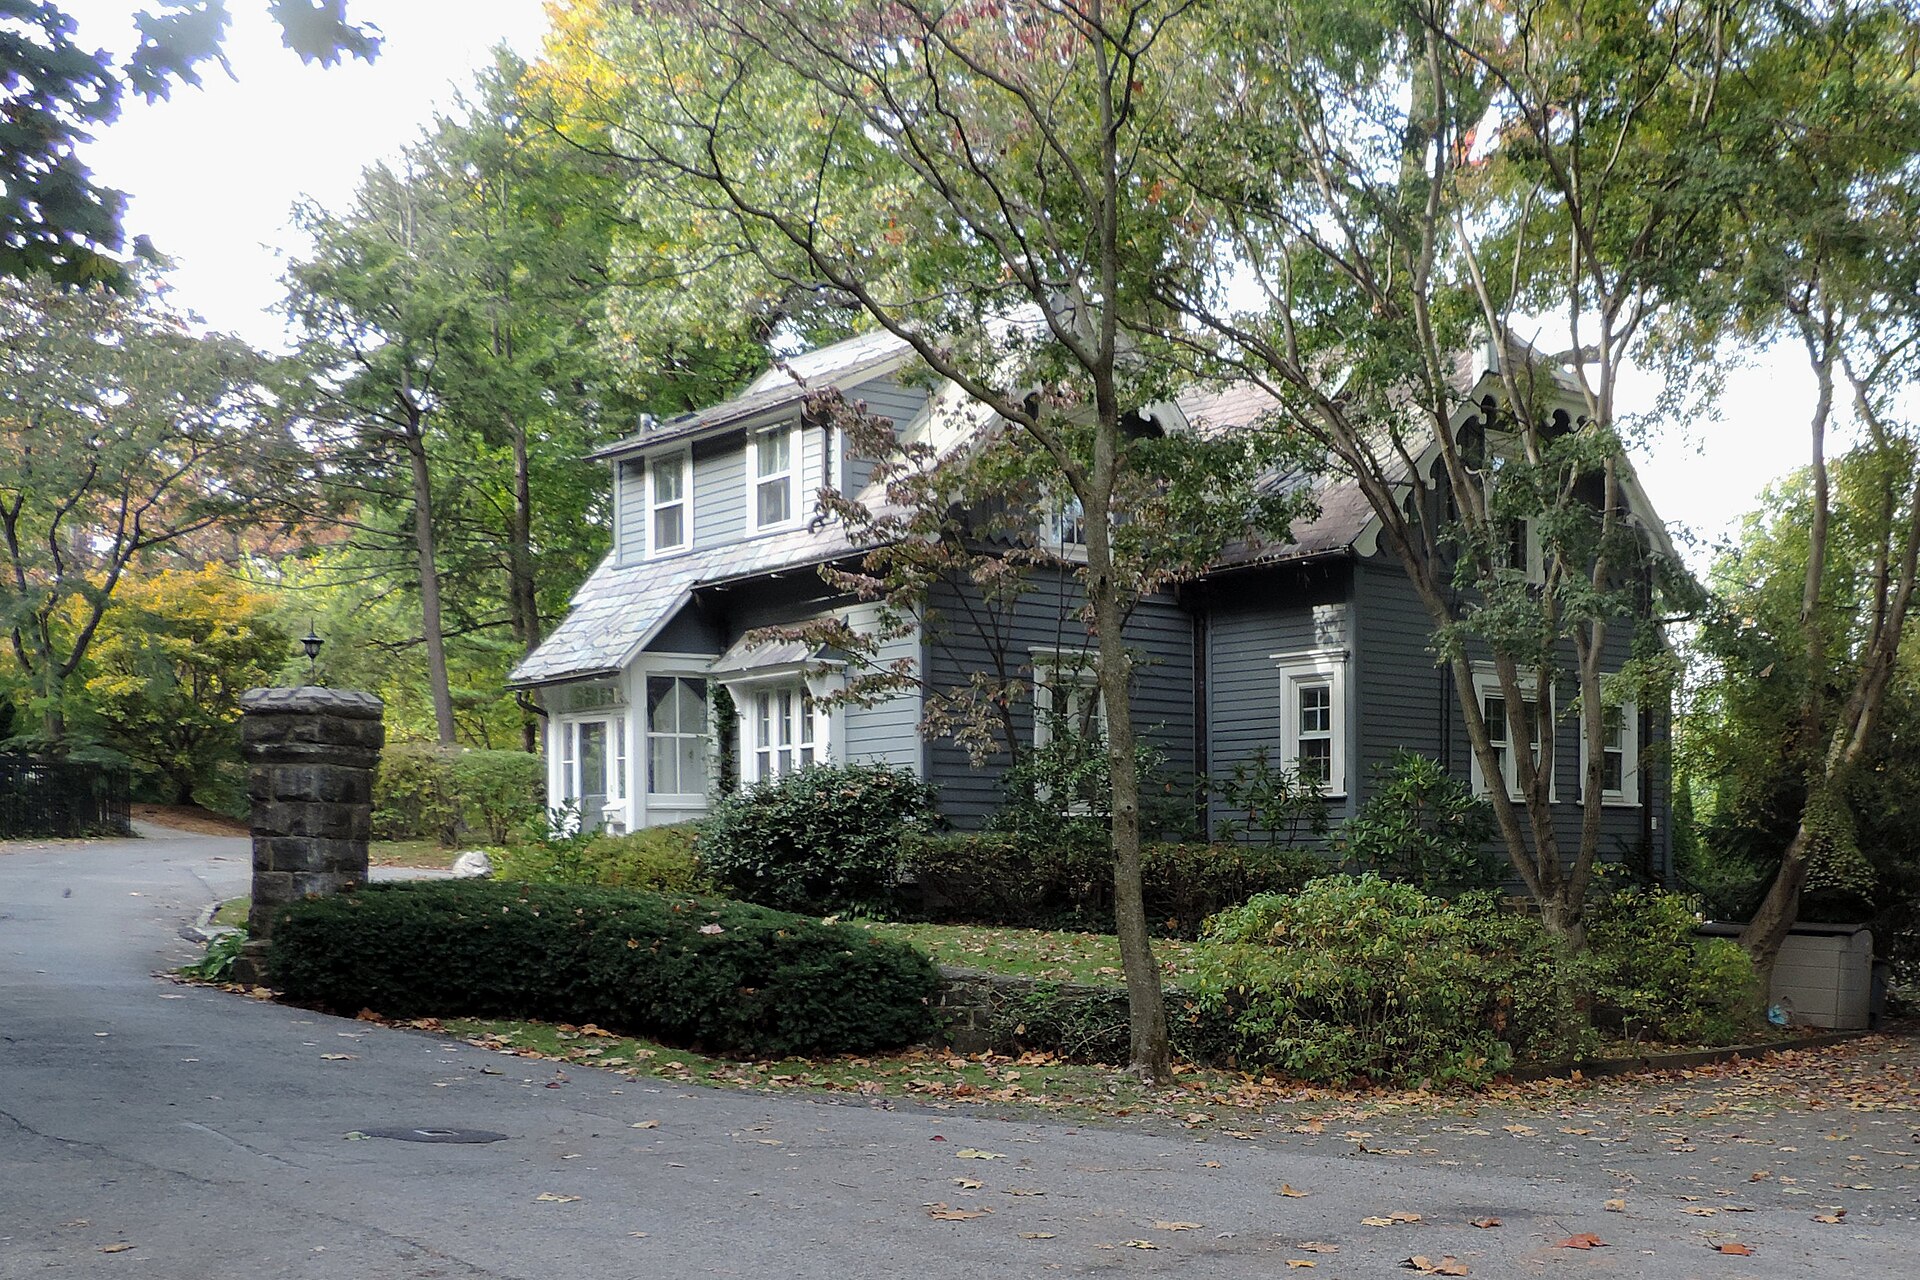
4695 Independ Avenue Riverdale, Riverdale-Spuyten Duyvil You checked the neighborhood.Now check an address ! Photo: Jim.henderson, CC BY 3.0 · Wikimedia Commons

For $34.00 a CrimesLog™ Home Report provides: (where available)

  • Nearest 6 Pre-school Nurseries to Address
  • Nearest 6 Primary Schools to Address
  • Nearest 6 Secondary/High Schools to Address
  • Nearest College and University to Address
  • Nearest to Address Medical Clinics, Hospitals and Pharmacies
  • Nearest 2 Police Station details to Address

The Home Report also provides

  • The CrimesLog™ Home Score is a proprietary Home Safety Measure capturing crime frequency, severity, recency and proximity to Address from police crime reporting point
  • A map indicating police anonymized crime reporting points around Address
  • Crime category trendlines for Address neighborhood
  • List of Reported Crime Incidents around Address radius
  • Downloadable PDF report — A Permanent Copy to Keep and Share to aid your Property Research
  • Our crimes database of almost 60 million records is UPDATED EVERY MONTH from US, UK, CA police sources
4695 Independ Avenue Riverdale, Riverdale-Spuyten Duyvil
Riverdale-Spuyten Duyvil · 4695 Independ Avenue Riverdale
Photo: Jim.henderson, CC BY 3.0 · Wikimedia Commons
AECOM, Morris Park
Morris Park · AECOM
Photo: Dave Johnson, CC BY 3.0 · Wikimedia Commons
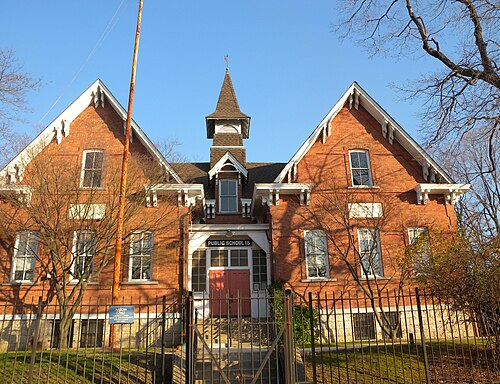
Dark Dyre PS15, Eastchester-Edenwald-Baychester
Eastchester-Edenwald-Baychester · Dark Dyre PS15
Photo: Jim.henderson, CC0 · Wikimedia Commons
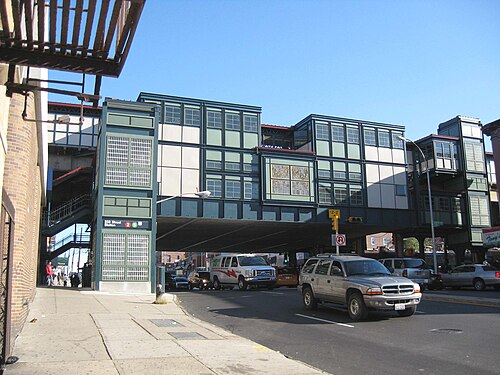
233 IRT 25 Station, Wakefield-Woodlawn
Wakefield-Woodlawn · 233 IRT 25 Station
Photo: Jim.henderson, Public domain · Wikimedia Commons
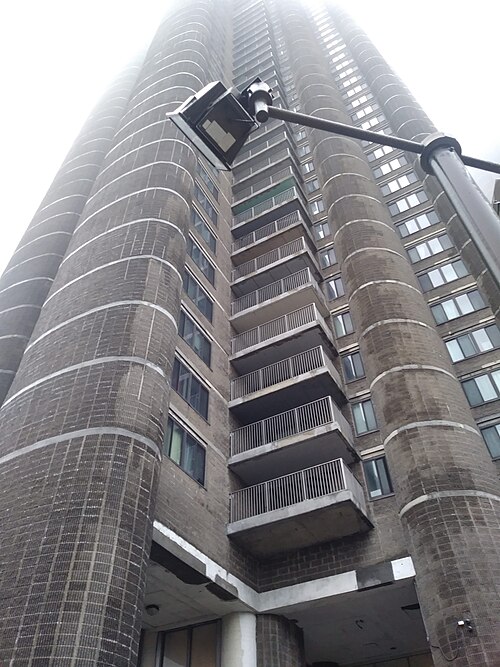
How the Windows Are Placed on Tracey Towers, as Well as Balconies, in the Bronx, Bedford Park
Bedford Park · How the Windows Are Placed on Tracey Towers, as Well as Balconies, in the Bronx
Photo: ReallyMysteriousQuestionMark, CC0 · Wikimedia Commons
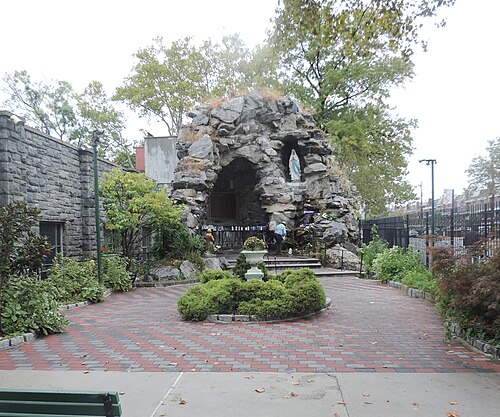
Lucy Grotto Idle Cloudy, Allerton
Allerton · Lucy Grotto Idle Cloudy
Photo: Jim.henderson, CC0 · Wikimedia Commons
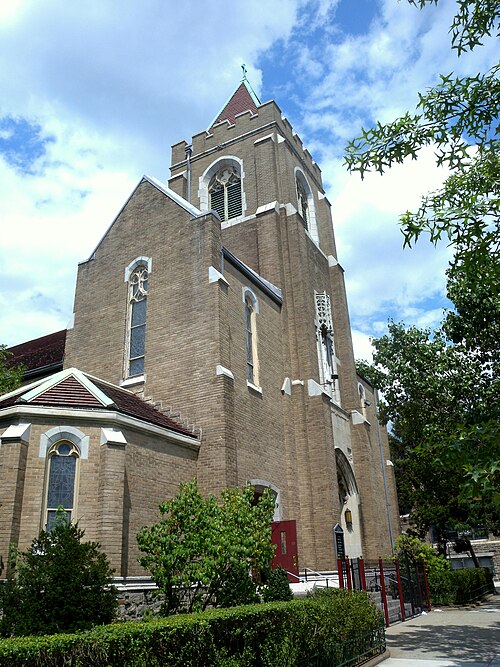
Lady of Solace Roman Catholic Church, Pelham Parkway-Van Nest
Pelham Parkway-Van Nest · Lady of Solace Roman Catholic Church
Photo: Jim.henderson, CC0 · Wikimedia Commons
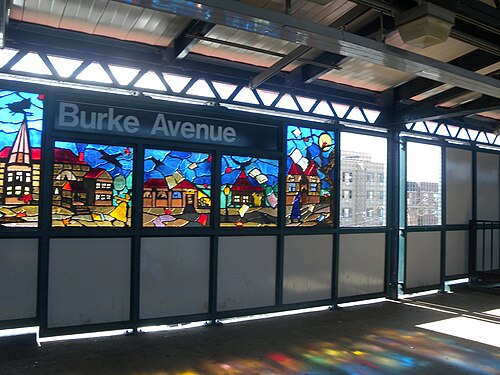
Burke Avenue IRTWP Southbound Platform, Williamsbridge-Olinville
Williamsbridge-Olinville · Burke Avenue IRTWP Southbound Platform
Photo: Jim.henderson, CC0 · Wikimedia Commons

How neighborhoods moved each quarter

2022

Whole-area crime rate 16.2 to 17.7 per 1,000 (high: Q3 2022).

Big moves (4+ places in a quarter): moved up Wakefield-Woodlawn 11th→6th (Q4) moved down Morris Park 7th→11th (Q4)

2023

Whole-area crime rate 16.5 to 18.7 per 1,000 (high: Q4 2023).

Big moves (4+ places in a quarter): moved up University Heights (South)-Morris Heights 10th→6th (Q2) moved up Morris Park 11th→7th (Q3) moved down University Heights (South)-Morris Heights 6th→13th (Q3) moved up Eastchester-Edenwald-Baychester 10th→6th (Q4) moved up University Heights (South)-Morris Heights 13th→7th (Q4) moved down Wakefield-Woodlawn 6th→11th (Q4)

2024

Whole-area crime rate 18.0 to 19.8 per 1,000 (high: Q3 2024).

Big moves (4+ places in a quarter): moved up Wakefield-Woodlawn 11th→6th (Q1) moved down Wakefield-Woodlawn 6th→12th (Q2) moved up Morris Park 7th→3rd (Q3)

2025

Whole-area crime rate 18.3 to 21.0 per 1,000 (high: Q2 2025).

Big moves (4+ places in a quarter): moved up Norwood 11th→6th (Q1) moved up Kingsbridge-Marble Hill 18th→12th (Q1) moved up Wakefield-Woodlawn 11th→7th (Q2) moved up Pelham Parkway-Van Nest 14th→10th (Q3) moved down Bedford Park 9th→13th (Q3) moved down Norwood 6th→10th (Q4)

2026

Whole-area crime rate 19.0 to 20.6 per 1,000 (high: Q2 2026). 2 quarters so far.

Big moves (4+ places in a quarter): moved down Wakefield-Woodlawn 6th→11th (Q1)

Reported Safety Incidents

In Q2 2026: public order incidents were 41% (6,329), violent incidents were 23% (3,584), property incidents were 22% (3,432) and vehicle crimes were 8% (1,302).

Recorded crime here is grouped into violent crime, property crime (burglary and theft), vehicle crime and public order offences, so you can compare how safe each neighborhood is for the kind of crime that matters to you.

Read category comparisons with care. A category that jumps while the total hardly moves looks like a change in how offences are classified, not in what happened: Q4 2022: vehicle up 35% while the total moved 3%; Q1 2026: violent down 36% while the total moved 3%. The whole-area rate is the steadier guide.

Places we left out, and places to read with care

Left out: Bronx Park; Hart Island; Van Cortlandt Park; Woodlawn Cemetery. They have almost no residents: their crimes are against visitors, so a rate per resident says little about living there.

Pelham Bay Park is a large park with very few residents (396.1 per 1,000 from 61 crimes among 154 residents), so it is not named as the lowest or highest. Hutchinson Metro Center is a business park with few residents (137.7 per 1,000 from 73 crimes among 530 residents), so it is not named as the lowest or highest.

The 21 neighborhoods on the map

Bronx North is made of 21 neighborhoods compared here, each in its own colour on the map. They are the City Planning “Neighborhood Tabulation Areas”: 743,880 residents between them.

  • Allerton
  • Bedford Park
  • Belmont
  • Co-op City
  • Eastchester-Edenwald-Baychester
  • Fordham Heights
  • Hutchinson Metro Center
  • Kingsbridge Heights-Van Cortlandt Village
  • Kingsbridge-Marble Hill
  • Morris Park
  • Mount Hope
  • Norwood
  • Pelham Bay Park
  • Pelham Gardens
  • Pelham Parkway-Van Nest
  • Riverdale-Spuyten Duyvil
  • Tremont
  • University Heights (North)-Fordham
  • University Heights (South)-Morris Heights
  • Wakefield-Woodlawn
  • Williamsbridge-Olinville

All 21 neighborhoods, Q2 2026

Crimes per 1,000 residents, Q2 2026, lowest first. The last two columns compare with Q1 2022.
#NeighborhoodResidentsAllViolentPropertyVehiclePublic orderRate vs Q1 2022Places gained
1Riverdale-Spuyten Duyvil47,4308.00.92.01.03.8up16%–
2Pelham Gardens27,83211.31.42.51.54.9down6%up3
3Co-op City36,00013.11.72.31.76.9up55%down1
4Kingsbridge Heights-Van Cortlandt Village33,26113.72.42.81.76.3up20%–
5Morris Park23,54517.24.33.21.27.8up29%up1
6University Heights (South)-Morris Heights53,62417.45.23.51.36.5up16%up3
7Eastchester-Edenwald-Baychester51,21317.54.03.91.77.2up9%up5
8Norwood39,55618.25.73.61.17.1up37%down1
9Wakefield-Woodlawn49,57418.55.54.11.56.8up9%up4
10Bedford Park49,14820.94.55.01.39.0up85%down7
11Allerton33,06721.04.84.31.29.6up31%–
12Pelham Parkway-Van Nest28,95521.34.86.91.67.2up51%down4
13Williamsbridge-Olinville57,66323.95.66.32.08.8up50%down3
14University Heights (North)-Fordham42,30524.45.05.52.99.8up30%–
15Belmont35,60824.45.55.51.710.6down18%up3
16Tremont32,42826.67.25.91.710.9up14%up1
17Kingsbridge-Marble Hill24,00428.95.43.71.617.5down4%up2
18Fordham Heights30,86332.47.88.53.610.8up69%down3
19Mount Hope47,12032.48.46.92.613.1up56%down3
20Hutchinson Metro Center †530137.741.524.57.564.2up55%–
21Pelham Bay Park †154396.177.9129.977.964.9up165%–

† Pelham Bay Park is a large park with very few residents; Hutchinson Metro Center is a business park with few residents. A rate on a very small number of residents or crimes is not comparable with the others.

Photographs

70 photographs of the 21 neighborhoods run along the reel; click one to see it full size. Each is credited here and under the large view.

All 70 photographs and their credits
  1. Riverdale-Spuyten Duyvil · 4695 Independ Avenue Riverdale. Photo: Jim.henderson, CC BY 3.0 · Wikimedia Commons
  2. Morris Park · AECOM. Photo: Dave Johnson, CC BY 3.0 · Wikimedia Commons
  3. Eastchester-Edenwald-Baychester · Dark Dyre PS15. Photo: Jim.henderson, CC0 · Wikimedia Commons
  4. Wakefield-Woodlawn · 233 IRT 25 Station (IRT = Interborough Rapid Transit, a New York City subway division). Photo: Jim.henderson, Public domain · Wikimedia Commons
  5. Bedford Park · How the Windows Are Placed on Tracey Towers, as Well as Balconies, in the Bronx. Photo: ReallyMysteriousQuestionMark, CC0 · Wikimedia Commons
  6. Allerton · Lucy Grotto Idle Cloudy. Photo: Jim.henderson, CC0 · Wikimedia Commons
  7. Pelham Parkway-Van Nest · Lady of Solace Roman Catholic Church. Photo: Jim.henderson, CC0 · Wikimedia Commons
  8. Williamsbridge-Olinville · Burke Avenue IRTWP Southbound Platform. Photo: Jim.henderson, CC0 · Wikimedia Commons
  9. University Heights (North)-Fordham · Crotonwalkford. Photo: Jim.henderson, Public domain · Wikimedia Commons
  10. Belmont · 183rd St Station. Photo: Jack Boucher, Public domain · Wikimedia Commons
  11. Tremont · Bronx Borough Hall 1897. Photo: George Stonebridge, Public domain · Wikimedia Commons
  12. Kingsbridge-Marble Hill · CoE Mediator Kingsbridge Avenue 231. Photo: Jim.henderson, Public domain · Wikimedia Commons
  13. Fordham Heights · East Fordham Road. Photo: Bigtimepeace, Public domain · Wikimedia Commons
  14. Mount Hope · Bx 46 Precinct. Photo: Jim.henderson, CC0 · Wikimedia Commons
  15. Pelham Bay Park · Coop City Pelham Bridge. Photo: Jim.henderson, Public domain · Wikimedia Commons
  16. Bronx Park · Bronx River Northern NYBG. Photo: Jim.henderson, CC0 · Wikimedia Commons
  17. Van Cortlandt Park · 242 Street Entrance. Photo: TheTurducken, CC BY 2.0 · Wikimedia Commons
  18. Woodlawn Cemetery · Bronx Woodlawn 8 Manger. Photo: Seauton, 12 April 2025, CC BY 4.0 · Wikimedia Commons
  19. Morris Park · AECOM Courtyard. Photo: HAL333, CC0 · Wikimedia Commons
  20. Eastchester-Edenwald-Baychester · 225 Street 7th 2. Photo: Melanie Lazarow from Brunswick, Australia, CC BY 2.0 · Wikimedia Commons
  21. Wakefield-Woodlawn · Francis Assisi School Bx Cloudy. Photo: Jim.henderson, CC0 · Wikimedia Commons
  22. Allerton · Lucy Roman Catholic Church 833 Mace Avenue Door. Photo: Jim.henderson, CC0 · Wikimedia Commons
  23. Williamsbridge-Olinville · 47 Precinct WPR E229 St. Photo: Jim.henderson, CC0 · Wikimedia Commons
  24. University Heights (North)-Fordham · Fordham Road Station (IRT Jerome Avenue Line) (IRT = Interborough Rapid Transit, a New York City subway division). Photo: Paul Lowry, CC BY 2.0 · Wikimedia Commons
  25. Belmont · Blue Chapel, Fordham University (2011). Photo: unknown author, CC BY 3.0 · Wikimedia Commons
  26. Kingsbridge-Marble Hill · 231 IRT Northbound Platform (IRT = Interborough Rapid Transit, a New York City subway division). Photo: Jim.henderson, CC0 · Wikimedia Commons
  27. Fordham Heights · GC Under Fordham Road. Photo: Jim.henderson, CC0 · Wikimedia Commons
  28. Mount Hope · CBX 174 GC. Photo: Jim.henderson, CC0 · Wikimedia Commons
  29. Pelham Bay Park · Bruckner Exp 8B. Photo: Jim.henderson, Public domain · Wikimedia Commons
  30. Bronx Park · Flamingo Island. Photo: Eden, Janine and Jim from New York City, CC BY 2.0 · Wikimedia Commons
  31. Van Cortlandt Park · Cortlandthenge Sunny PM. Photo: Jim.henderson, Public domain · Wikimedia Commons
  32. Woodlawn Cemetery · Bronx Woodlawn Untermyer 1. Photo: Seauton, 11 April 2025, Public domain · Wikimedia Commons
  33. Morris Park · AECOM Courtyard 2. Photo: HAL333, CC0 · Wikimedia Commons
  34. Wakefield-Woodlawn · Frances of Rome Bx West Cloudy. Photo: Jim.henderson, CC0 · Wikimedia Commons
  35. Allerton · Lucy Rectory 833 Mace Avenue Cloudy. Photo: Jim.henderson, CC0 · Wikimedia Commons
  36. Williamsbridge-Olinville · 225 IRTWP Southbound Platform. Photo: Jim.henderson, CC0 · Wikimedia Commons
  37. University Heights (North)-Fordham · Fordham Center, The Bronx, April 2025. Photo: Paul Lowry, CC BY 2.0 · Wikimedia Commons
  38. Kingsbridge-Marble Hill · 50 Precinct NYPD KB Avenue 236. Photo: Jim.henderson, CC0 · Wikimedia Commons
  39. Fordham Heights · 183 Street. Photo: August Muench from Lincoln, United States, CC BY 2.0 · Wikimedia Commons
  40. Mount Hope · 175 Concourse Line Underpass. Photo: Jim.henderson, CC0 · Wikimedia Commons
  41. Pelham Bay Park · City Island and Hart Island. Photo: Gabe29, CC BY 4.0 · Wikimedia Commons
  42. Bronx Park · Bronx River. Photo: Eden, Janine and Jim from New York City, CC BY 2.0 · Wikimedia Commons
  43. Van Cortlandt Park · Greenway North of Cortlandt Bridge. Photo: Jim.henderson, CC BY 4.0 · Wikimedia Commons
  44. Woodlawn Cemetery · Bronx Woodlawn Vietor 1. Photo: Seauton, 11 April 2025, Public domain · Wikimedia Commons
  45. Morris Park · Albert Einstein College Morning View. Photo: HAL333, CC0 · Wikimedia Commons
  46. Wakefield-Woodlawn · 47 Precinct Door WPR. Photo: Jim.henderson, CC0 · Wikimedia Commons
  47. Williamsbridge-Olinville · 219 IRTWP Southbound Platform. Photo: Jim.henderson, CC0 · Wikimedia Commons
  48. University Heights (North)-Fordham · 183irtlong. Photo: Jim.henderson, Public domain · Wikimedia Commons
  49. Kingsbridge-Marble Hill · 240 IRT Yard from Train (IRT = Interborough Rapid Transit, a New York City subway division). Photo: Jim.henderson, CC0 · Wikimedia Commons
  50. Fordham Heights · Fordham Road. Photo: August Muench from Lincoln, United States, CC BY 2.0 · Wikimedia Commons
  51. Mount Hope · Church Eastburn GC 175. Photo: Jim.henderson, CC0 · Wikimedia Commons
  52. Bronx Park · Bronx River from Bridge Near Mitsubishi Riverwalk 1 in August 2026. Photo: SnowFire, CC BY 4.0 · Wikimedia Commons
  53. Woodlawn Cemetery · Bronx Woodlawn Bertsch 2. Photo: Seauton, 12 April 2025, Public domain · Wikimedia Commons
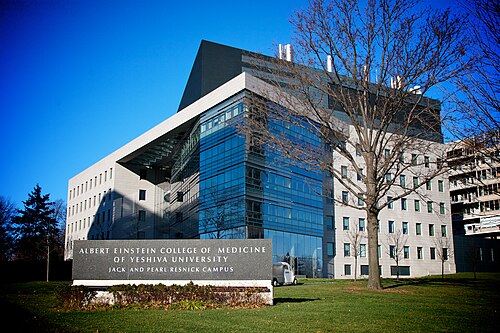
  54. Morris Park · Albert Einstein College of Medicine Sign. Photo: HAL333, CC0 · Wikimedia Commons
  55. Wakefield-Woodlawn · EMS Station 15 FDNY WPR. Photo: Jim.henderson, CC0 · Wikimedia Commons
  56. Williamsbridge-Olinville · 211 St BRP South Plaque. Photo: Jim.henderson, CC0 · Wikimedia Commons
  57. University Heights (North)-Fordham · Devoe Park, the Bronx in Late Autumn. Photo: Kenneth C. Zirkel, CC BY 4.0 · Wikimedia Commons
  58. Kingsbridge-Marble Hill · Broadway Bridge. Photo: Reading Tom from Reading, UK, CC BY 2.0 · Wikimedia Commons
  59. Fordham Heights · Brocker 000308 173001 518483 4578. Photo: Photo by Bright Power, Inc. – U.S. Department of Energy from United States, Public domain · Wikimedia Commons
  60. Mount Hope · 174-175 IND GC Station (IND = Independent Subway System, a New York City subway division). Photo: Jim.henderson, CC0 · Wikimedia Commons
  61. Bronx Park · Bronx Zoo Boat House -- About 1910. Photo: Jim Griffin, CC0 · Wikimedia Commons
  62. Woodlawn Cemetery · Bronx Woodlawn 4. Photo: Seauton, CC BY 4.0 · Wikimedia Commons
  63. Morris Park · Jacobi Hospital and Albert Einstein Labs. Photo: HAL333, CC BY 4.0 · Wikimedia Commons
  64. Wakefield-Woodlawn · 233 Street Art. Photo: TheTurducken, CC BY 2.0 · Wikimedia Commons
  65. Williamsbridge-Olinville · 5-Alarm Fire, White Plains Road. Photo: Metropolitan Transportation Authority of the State of New York, CC BY 2.0 · Wikimedia Commons
  66. Kingsbridge-Marble Hill · "We Are the No. 1" Sign at Van Cortlandt Park - 242nd Street. Photo: 4300streetcar, CC BY 4.0 · Wikimedia Commons
  67. Bronx Park · Bronx Monorail. Photo: Jim.henderson, Public domain · Wikimedia Commons
  68. Woodlawn Cemetery · Bronx Woodlawn 6. Photo: Seauton, CC BY 4.0 · Wikimedia Commons
  69. Williamsbridge-Olinville · 5-Alarm Fire, White Plains Road. Photo: Metropolitan Transportation Authority of the State of New York, CC BY 2.0 · Wikimedia Commons
  70. Woodlawn Cemetery · Bronx Woodlawn 3. Photo: Seauton, CC BY 4.0 · Wikimedia Commons

Sources and notes

CrimesLog sources crime incident data published by the New York City Police Department (NYPD) through the NYC Open Data Portal, containing public sector information governed by the NYC Open Data Law (Local Law 11 of 2012) and the NYC.gov Terms of Use.

Population: U.S. Census Bureau, American Community Survey 5-year estimates (public domain).

First-place medal: 1st Place Medal emoji icon by Icons8.

Neighborhood boundaries are defined by NYC Department of City Planning, 2020 Neighborhood Tabulation Areas (NYC Open Data), merged and simplified by CrimesLog. The photographs are credited under each picture.

Rates are recorded crimes per 1,000 residents, quarter by quarter; where a neighborhood has fewer than 100 residents the rate would be worked out on 100 (those places are left out of the race). A count of recorded crime is not a verdict on any neighborhood.