Los Angeles, California · Neighborhood crime trends

Los Angeles South LA and Harbor

27 neighborhoods - a quarterly race to the lowest crime rate.

Crime Trends: Neighborhoods compared - each quarter from Q1 2022

Los Angeles as a whole averaged 14.4 crimes for every 1,000 residents per quarter in Q2 2026, while South LA and Harbor averaged 15.8, hence it is generally less safe when all crimes are considered.

How do the 27 neighborhoods of South LA and Harbor compare? In Q2 2026 the police recorded 13,400 crimes across them, 15.8 for every 1,000 residents. That is 2.5% above a year earlier and 0.7% below Q1 2022, the first quarter we track.

Harbor City has the lowest rate of the everyday neighborhoods (9.1 per 1,000), followed by San Pedro (9.3) and Jefferson Park (10.5). Leimert Park has the highest (24.9).

Use the RACE CHARTS below to watch all 27 LOS ANGELES SOUTH LA AND HARBOR NEIGHBORHOODs race across 18 quarter periods from Q1 2022 to Q2 2026 - one crime category at a time or all together. The race chart can be used to compare average crime rates by category against Los Angeles's average.

Neighborhood boundaries are defined by Mapping L.A. (Los Angeles Times, CC BY 4.0) and simplified by CrimesLog.
Lowest rate (everyday)
lowest rateHarbor City
9.1 crimes per 1,000 residents, Q2 2026
Highest rate
upLeimert Park
24.9 per 1,000, Q2 2026
Whole area, Q2 2026
15.8 per 1,000
up 2.5% above a year earlier · down 0.7% below Q1 2022
Compared
27 neighborhoods
848,376 residents · 18 quarters

Los Angeles South LA and Harbor neighborhood quarterly crime race

Press ▶︎ to watch Q1 2022 to Q2 2026. Tick one crime category or several; hover a bar for the neighborhood. Property crimes includes burglaries and thefts.

Crime categories
Indicated: crimes rate per 1000 residents per quarterAll · safest at the top · square-root scale · Q1 2022 to Q2 20260151011.3Adams-Normandie19.4Baldwin Hills/Crenshaw17.3Broadway-Manchester12.8Central-Alameda23.5Chesterfield Square16.2Exposition Park17.4Florence12.8Gramercy Park18.1Green Meadows11.5Harbor City13.8Harbor Gateway16.2Harvard Park19.6Historic South-Central15.0Hyde Park11.2Jefferson Park20.8Leimert Park16.3Manchester Square11.3San Pedro15.9South Park20.7University Park23.3Vermont Knolls21.3Vermont-Slauson14.2Vermont Square21.0Vermont Vista17.5Watts12.3West Adams13.7WilmingtonLos Angeles Q2 2026 average all crimes (14.4)Numbers are crimes per 1,000 residents per quarter. Zero-crime quarters show 0 and rank safest.
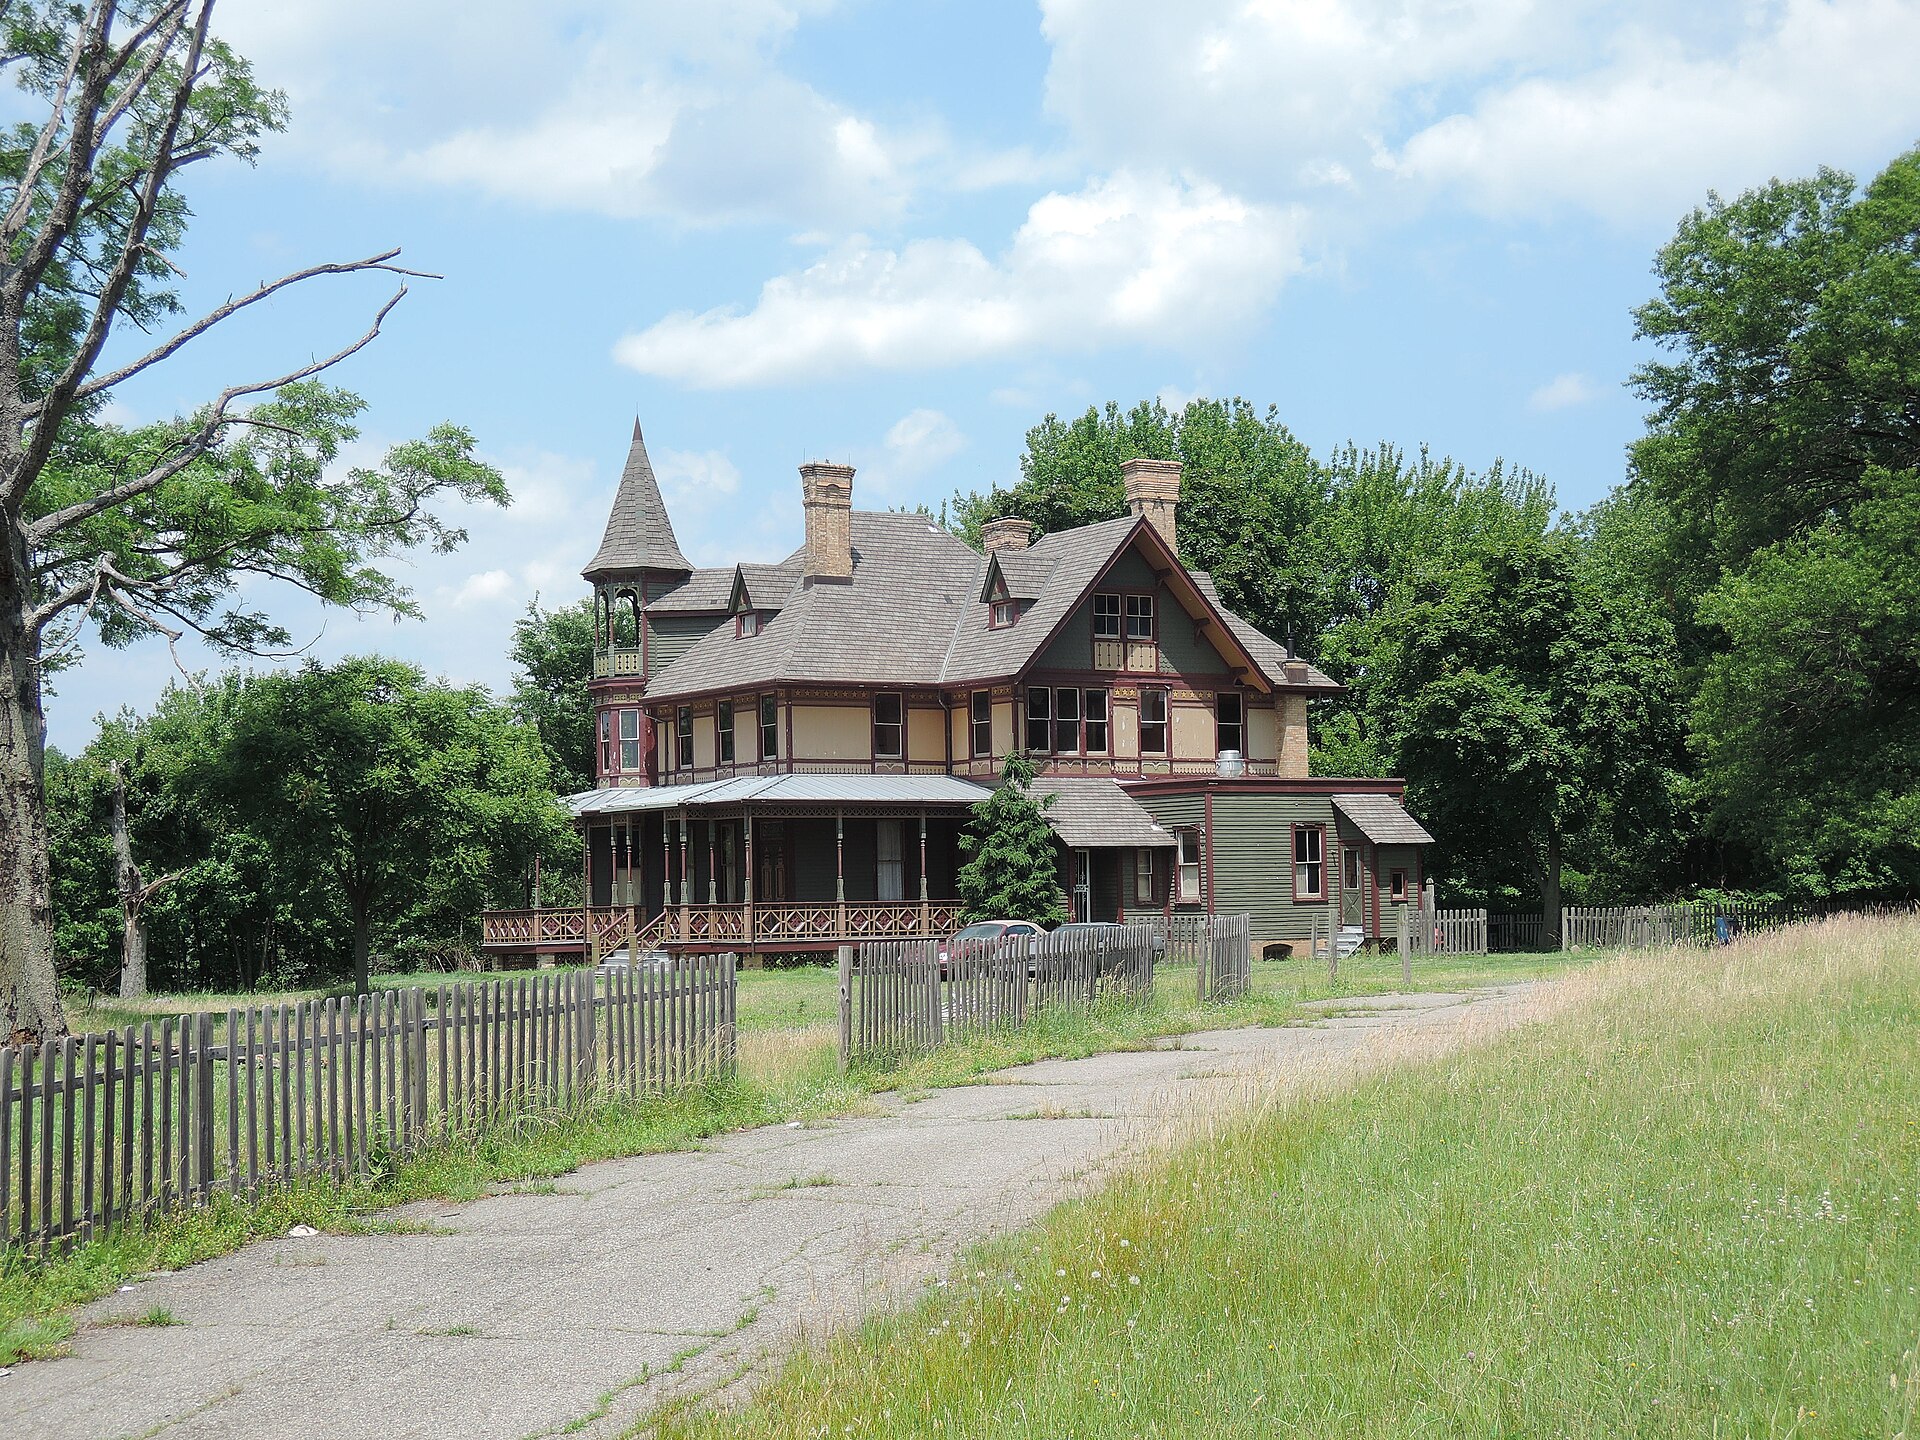
Kreischer House Uncut, Tottenville-Charleston You checked the neighborhood.Now check an address ! Photo: Jim.henderson, CC0 · Wikimedia Commons

For $34.00 a CrimesLog™ Home Report provides: (where available)

  • Nearest 6 Pre-school Nurseries to Address
  • Nearest 6 Primary Schools to Address
  • Nearest 6 Secondary/High Schools to Address
  • Nearest College and University to Address
  • Nearest to Address Medical Clinics, Hospitals and Pharmacies
  • Nearest 2 Police Station details to Address

The Home Report also provides

  • The CrimesLog™ Home Score is a proprietary Home Safety Measure capturing crime frequency, severity, recency and proximity to Address from police crime reporting point
  • A map indicating police anonymized crime reporting points around Address
  • Crime category trendlines for Address neighborhood
  • List of Reported Crime Incidents around Address radius
  • Downloadable PDF report — A Permanent Copy to Keep and Share to aid your Property Research
  • Our crimes database of almost 60 million records is UPDATED EVERY MONTH from US, UK, CA police sources
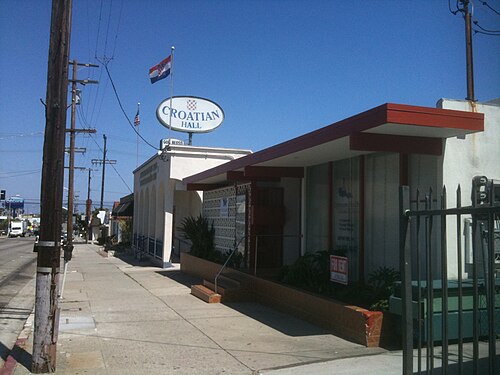
Croatian Place, San Pedro
San Pedro · Croatian Place
Photo: Reubenzadeh (talk) Reuben Zadeh, Public domain · Wikimedia Commons
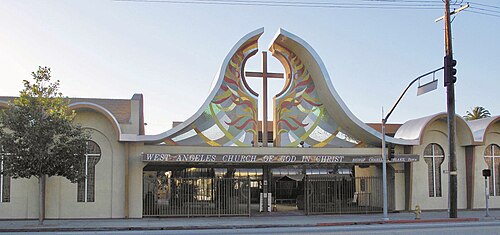
West Angeles Church of God in Christ 1, Jefferson Park
Jefferson Park · West Angeles Church of God in Christ 1
Photo: Downtowngal, Public domain · Wikimedia Commons
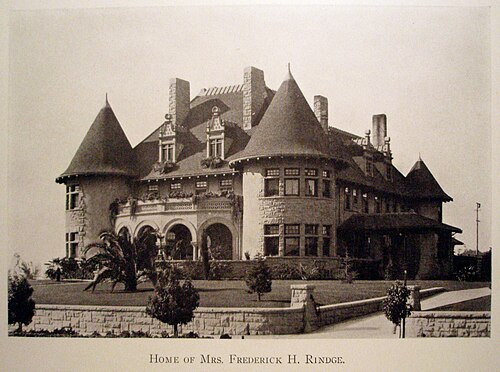
Frederick Rindge House 1910, Adams-Normandie
Adams-Normandie · Frederick Rindge House 1910
Photo: Editor: Robert J. Burdette, Public domain · Wikimedia Commons
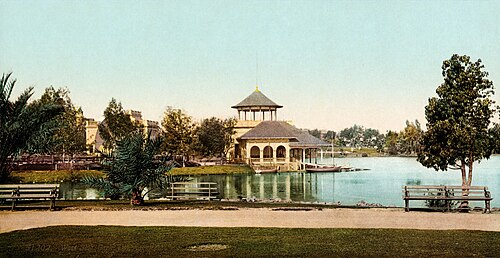
Flickr - …Trialsanderrors - West Side Park, Los Angeles, California, 1902, West Adams
West Adams · Flickr - …Trialsanderrors - West Side Park, Los Angeles, California, 1902
Photo: …trialsanderrors, CC BY 2.0 · Wikimedia Commons
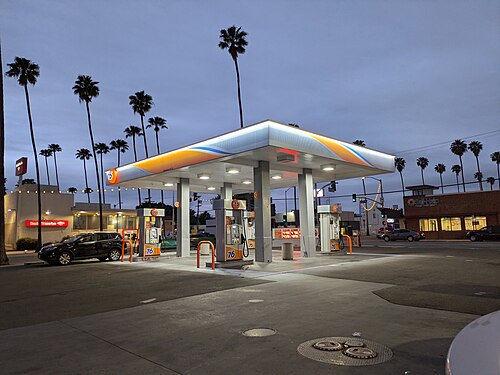
76 Gas Station - Roaming in the Gloaming, Wilmington
Wilmington · 76 Gas Station - Roaming in the Gloaming
Photo: joey zanotti from Rancho Palos Verdes, CA, USA, CC BY 2.0 · Wikimedia Commons
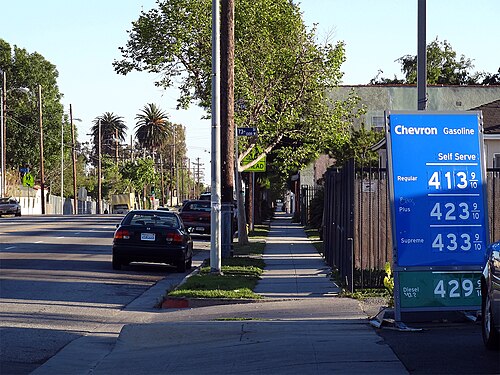
Florence Avenue & Normandie Avenue, Vermont Knolls
Vermont Knolls · Florence Avenue & Normandie Avenue
Photo: Craig Dietrich from Los Angeles, CC BY 2.0 · Wikimedia Commons
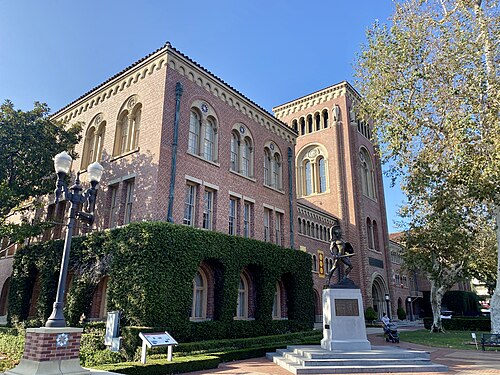
Bovard Auditorium Side View, University Park
University Park · Bovard Auditorium Side View
Photo: EEJCC, CC0 · Wikimedia Commons
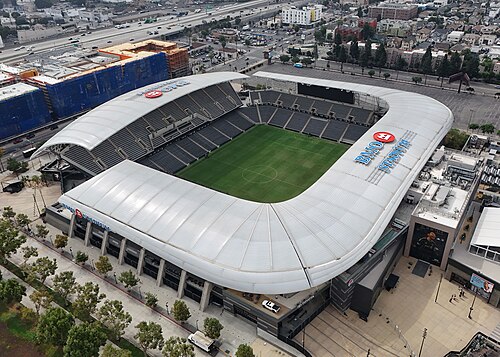
BMO Stadium (Los Angeles), Exposition Park
Exposition Park · BMO Stadium (Los Angeles)
Photo: Quintin Soloviev, CC BY 4.0 · Wikimedia Commons

How neighborhoods moved each quarter

2022

Whole-area crime rate 15.9 to 18.1 per 1,000 (high: Q2 2022).

Big moves (4+ places in a quarter): moved up Manchester Square 15th→10th (Q2) moved up Baldwin Hills/Crenshaw 20th→13th (Q2) moved down Gramercy Park 6th→18th (Q2) moved up Leimert Park 23rd→19th (Q2) moved up Vermont Vista 24th→20th (Q2) moved down Broadway-Manchester 16th→21st (Q2) moved down Green Meadows 19th→25th (Q2) moved up West Adams 7th→3rd (Q3) moved down Adams-Normandie 2nd→6th (Q3) moved up Harvard Park 17th→12th (Q3) moved down Manchester Square 10th→16th (Q3) moved down Baldwin Hills/Crenshaw 13th→17th (Q3) moved up Green Meadows 25th→19th (Q3) moved up Vermont-Slauson 26th→21st (Q3) moved down Vermont Vista 20th→24th (Q3) moved up Central-Alameda 7th→3rd (Q4) moved down Jefferson Park 2nd→10th (Q4) moved up Gramercy Park 20th→11th (Q4) moved up Manchester Square 16th→12th (Q4) moved up Vermont Vista 24th→17th (Q4) moved down Hyde Park 10th→18th (Q4) moved up Broadway-Manchester 23rd→19th (Q4) moved down Baldwin Hills/Crenshaw 17th→22nd (Q4) moved down Green Meadows 19th→25th (Q4)

2023

Whole-area crime rate 16.4 to 17.6 per 1,000 (high: Q3 2023).

Big moves (4+ places in a quarter): moved up Adams-Normandie 6th→2nd (Q1) moved down Central-Alameda 3rd→8th (Q1) moved up Hyde Park 18th→11th (Q1) moved up Vermont Knolls 23rd→15th (Q1) moved down Gramercy Park 11th→18th (Q1) moved down Manchester Square 12th→20th (Q1) moved down Broadway-Manchester 19th→23rd (Q1) moved down Leimert Park 20th→24th (Q1) moved down West Adams 4th→8th (Q2) moved down Wilmington 6th→10th (Q2) moved up Baldwin Hills/Crenshaw 19th→12th (Q2) moved up Manchester Square 20th→13th (Q2) moved up Broadway-Manchester 23rd→17th (Q2) moved up University Park 26th→19th (Q2) moved down Hyde Park 11th→20th (Q2) moved down Vermont Vista 16th→23rd (Q2) moved down Vermont Knolls 15th→26th (Q2) moved up Jefferson Park 7th→2nd (Q3) moved down South Park 9th→14th (Q3) moved up Hyde Park 20th→15th (Q3) moved up Vermont-Slauson 25th→20th (Q3) moved down Exposition Park 15th→21st (Q3) moved down University Park 19th→25th (Q3) moved up Adams-Normandie 7th→2nd (Q4) moved down Jefferson Park 2nd→7th (Q4) moved up South Park 14th→10th (Q4) moved up Gramercy Park 16th→11th (Q4) moved down Baldwin Hills/Crenshaw 11th→15th (Q4) moved down Harvard Park 12th→16th (Q4) moved up Vermont Knolls 26th→19th (Q4) moved down Leimert Park 22nd→26th (Q4)

2024

Whole-area crime rate 15.4 to 16.8 per 1,000 (high: Q3 2024).

Big moves (4+ places in a quarter): moved up Vermont Square 9th→3rd (Q1) moved down Adams-Normandie 2nd→9th (Q1) moved up West Adams 8th→3rd (Q2) moved up Manchester Square 15th→4th (Q2) moved down Central-Alameda 2nd→7th (Q2) moved down Vermont Square 3rd→10th (Q2) moved down Wilmington 7th→11th (Q2) moved up Baldwin Hills/Crenshaw 16th→12th (Q2) moved down Watts 11th→16th (Q2) moved down Florence 14th→18th (Q2) moved up Vermont Vista 24th→20th (Q2) moved down Historic South-Central 21st→26th (Q2) moved up South Park 8th→2nd (Q3) moved up Vermont Square 10th→6th (Q3) moved down Manchester Square 4th→10th (Q3) moved up Watts 16th→12th (Q3) moved down West Adams 3rd→16th (Q3) moved up Vermont-Slauson 22nd→18th (Q3) moved down Gramercy Park 15th→19th (Q3) moved down Broadway-Manchester 17th→21st (Q3) moved up Historic South-Central 26th→22nd (Q3) moved up Manchester Square 10th→1st (Q4) moved up Harbor Gateway 7th→3rd (Q4) moved down South Park 2nd→8th (Q4) moved up West Adams 16th→10th (Q4) moved up Historic South-Central 22nd→16th (Q4) moved down Harvard Park 14th→18th (Q4) moved down Baldwin Hills/Crenshaw 11th→20th (Q4) moved down Vermont Knolls 17th→24th (Q4)

2025

Whole-area crime rate 14.8 to 15.5 per 1,000 (high: Q3 2025).

Big moves (4+ places in a quarter): moved up Adams-Normandie 6th→1st (Q1) moved down Manchester Square 1st→6th (Q1) moved up Baldwin Hills/Crenshaw 20th→9th (Q1) moved up Harvard Park 18th→12th (Q1) moved down Wilmington 11th→15th (Q1) moved up Exposition Park 23rd→18th (Q1) moved down Florence 14th→20th (Q1) moved down Vermont-Slauson 15th→21st (Q1) moved down Vermont Vista 21st→25th (Q1) moved up Jefferson Park 5th→1st (Q2) moved up Vermont Square 11th→6th (Q2) moved down Adams-Normandie 1st→9th (Q2) moved down San Pedro 7th→11th (Q2) moved down Baldwin Hills/Crenshaw 9th→14th (Q2) moved up University Park 24th→18th (Q2) moved down Florence 20th→24th (Q2) moved down Exposition Park 18th→25th (Q2) moved up San Pedro 11th→3rd (Q3) moved up Adams-Normandie 9th→4th (Q3) moved down University Park 18th→23rd (Q3) moved up Gramercy Park 17th→11th (Q4) moved down Vermont Square 8th→12th (Q4) moved down Watts 9th→14th (Q4) moved up Vermont Vista 24th→17th (Q4) moved down Harvard Park 14th→18th (Q4) moved down Green Meadows 16th→20th (Q4)

2026

Whole-area crime rate 15.2 to 15.8 per 1,000 (high: Q2 2026). 2 quarters so far.

Big moves (4+ places in a quarter): moved up Baldwin Hills/Crenshaw 15th→8th (Q1) moved up West Adams 13th→9th (Q1) moved down Manchester Square 6th→10th (Q1) moved up Harvard Park 18th→12th (Q1) moved down Hyde Park 10th→14th (Q1) moved down Gramercy Park 11th→21st (Q1) moved up Gramercy Park 21st→12th (Q2) moved down Vermont Knolls 16th→20th (Q2) moved up University Park 25th→21st (Q2)

Reported Safety Incidents

In Q2 2026: property incidents were 33% (4,460), violent incidents were 31% (4,202), vehicle crimes were 20% (2,698) and public order incidents were 14% (1,869).

Recorded crime here is grouped into violent crime, property crime (burglary and theft), vehicle crime and public order offences, so you can compare how safe each neighborhood is for the kind of crime that matters to you.

Places we left out, and places to read with care

No place is left out: every neighborhood in this race has residents to count.

The 27 neighborhoods on the map

South LA and Harbor is made of 27 neighborhoods compared here, each in its own colour on the map. They are the neighborhoods of Mapping L.A. (Los Angeles Times, CC BY 4.0), grouped into five areas of the city by CrimesLog: 848,376 residents between them.

  • Adams-Normandie
  • Baldwin Hills/Crenshaw
  • Broadway-Manchester
  • Central-Alameda
  • Chesterfield Square
  • Exposition Park
  • Florence
  • Gramercy Park
  • Green Meadows
  • Harbor City
  • Harbor Gateway
  • Harvard Park
  • Historic South-Central
  • Hyde Park
  • Jefferson Park
  • Leimert Park
  • Manchester Square
  • San Pedro
  • South Park
  • University Park
  • Vermont Knolls
  • Vermont Square
  • Vermont Vista
  • Vermont-Slauson
  • Watts
  • West Adams
  • Wilmington

All 27 neighborhoods, Q2 2026

Crimes per 1,000 residents, Q2 2026, lowest first. The last two columns compare with Q1 2022.
#NeighborhoodResidentsAllViolentPropertyVehiclePublic orderRate vs Q1 2022Places gained
1Harbor City25,5979.12.33.12.21.4down21%up3
2San Pedro83,5959.32.53.01.71.9down18%–
3Jefferson Park24,01410.52.73.42.81.5down6%down2
4Harbor Gateway39,66511.63.15.12.50.7down16%up5
5Adams-Normandie16,54211.72.44.43.41.5up4%down2
6West Adams21,85313.02.95.82.61.6up6%down1
7South Park32,76813.84.94.12.81.9down13%up5
8Central-Alameda41,84213.94.84.82.81.5up9%down1
9Wilmington51,11414.13.44.32.43.6up2%down1
10Manchester Square12,67114.45.33.43.71.7down12%up5
11Baldwin Hills/Crenshaw32,03514.54.76.22.21.2down26%up9
12Gramercy Park10,43214.64.54.24.41.4up14%down6
13Harvard Park11,60614.95.34.63.41.6down8%up1
14Hyde Park35,52715.05.25.13.51.0down0%down3
15Vermont Square52,01015.35.74.42.82.2up8%down5
16Watts38,05116.86.25.62.52.3down4%up2
17Green Meadows35,86118.56.46.23.32.5up2%up2
18Broadway-Manchester28,27019.07.33.94.52.9up10%down2
19Florence51,23419.47.35.14.52.2up11%down2
20Vermont Knolls23,71120.37.45.33.83.3down13%up6
21University Park24,39420.53.68.76.31.8down1%up1
22Vermont Vista25,99020.66.15.54.34.4down2%up2
23Vermont-Slauson30,43920.96.96.64.33.0down2%up2
24Historic South-Central47,12721.26.08.14.02.8up8%down3
25Exposition Park33,41421.56.28.33.13.7up33%down12
26Chesterfield Square6,20522.47.47.34.82.9down5%up1
27Leimert Park12,40924.97.011.83.22.3up20%down4

Photographs

24 photographs of the 27 neighborhoods run along the reel; click one to see it full size. Each is credited here and under the large view.

All 24 photographs and their credits
  1. San Pedro · Croatian Place. Photo: Reubenzadeh (talk) Reuben Zadeh, Public domain · Wikimedia Commons
  2. Jefferson Park · West Angeles Church of God in Christ 1. Photo: Downtowngal, Public domain · Wikimedia Commons
  3. Adams-Normandie · Frederick Rindge House 1910. Photo: Editor: Robert J. Burdette, Public domain · Wikimedia Commons
  4. West Adams · Flickr - …Trialsanderrors - West Side Park, Los Angeles, California, 1902. Photo: …trialsanderrors, CC BY 2.0 · Wikimedia Commons
  5. Wilmington · 76 Gas Station - Roaming in the Gloaming. Photo: joey zanotti from Rancho Palos Verdes, CA, USA, CC BY 2.0 · Wikimedia Commons
  6. Vermont Knolls · Florence Avenue & Normandie Avenue. Photo: Craig Dietrich from Los Angeles, CC BY 2.0 · Wikimedia Commons
  7. University Park · Bovard Auditorium Side View. Photo: EEJCC, CC0 · Wikimedia Commons
  8. Exposition Park · BMO Stadium (Los Angeles). Photo: Quintin Soloviev, CC BY 4.0 · Wikimedia Commons
  9. Wilmington · Chrysler New Yorker Fifth Avenue (1985). Photo: Charles from Port Chester, New York, CC BY 2.0 · Wikimedia Commons
  10. Vermont Knolls · Florence Avenue & Normandie Avenue. Photo: Craig Dietrich from Los Angeles, CC BY 2.0 · Wikimedia Commons
  11. University Park · Rotunda Natural History Museum of LA County. Photo: Ray Bouknight from Sacramento, CA, USA, CC BY 2.0 · Wikimedia Commons
  12. Exposition Park · L.A. Memorial Coliseum Entrance & Statues. Photo: Stephanie Kemna, Public domain · Wikimedia Commons
  13. Wilmington · ARCO , Gas Station. Photo: joey zanotti from Rancho Palos Verdes, CA, USA, CC BY 4.0 · Wikimedia Commons
  14. Vermont Knolls · Florence Avenue & Normandie Avenue. Photo: Craig Dietrich from Los Angeles, CC BY 2.0 · Wikimedia Commons
  15. University Park · Los Angeles CA 20220925 (17). Photo: Sony 1992, CC0 · Wikimedia Commons
  16. Exposition Park · Los Angeles CA 20220925 (33). Photo: Sony 1992, CC0 · Wikimedia Commons
  17. Wilmington · End of Fall Sunset In Explore 12-24-24 - Flickr - Joey Z1. Photo: joey zanotti from Rancho Palos Verdes, CA, USA, CC BY 2.0 · Wikimedia Commons
  18. University Park · McCarthy Honors College - USC. Photo: EEJCC, CC0 · Wikimedia Commons
  19. Exposition Park · 2008-0913-USCOSU-Pan01 3000px Tiltfixed. Photo: Bobak Ha'Eri, CC BY 2.5 · Wikimedia Commons
  20. University Park · Second Church of Christ, Scientist in Los Angeles. Photo: EEJCC, CC0 · Wikimedia Commons
  21. Exposition Park · Sunken Gardens and Museum, Exposition Park, Los Angeles, California. Photo: Boston Public Library, CC BY 2.0 · Flickr
  22. University Park · Evelia Looks at Nude Man 1. Photo: Seauton 13 April 2017, CC BY 4.0 · Wikimedia Commons
  23. University Park · Doheny South Door 1. Photo: Seauton 13 April 2017, CC BY 4.0 · Wikimedia Commons
  24. University Park · Street in University Park, Los Angeles. Photo: EEJCC, CC0 · Wikimedia Commons

Sources and notes

CrimesLog sources crime incident data published by the Los Angeles Police Department (LAPD) through the City of Los Angeles Open Data Portal (data.lacity.org), containing public sector information released under the Los Angeles Open Data Portal Terms of Use.

Population: U.S. Census Bureau, American Community Survey 5-year estimates (public domain).

First-place medal: 1st Place Medal emoji icon by Icons8.

Neighborhood boundaries are defined by Mapping L.A. (Los Angeles Times, CC BY 4.0), grouped into five areas of the city by CrimesLog and simplified by CrimesLog. The photographs are credited under each picture.

Rates are recorded crimes per 1,000 residents, quarter by quarter; where a neighborhood has fewer than 100 residents the rate would be worked out on 100 (those places are left out of the race). A count of recorded crime is not a verdict on any neighborhood.