New York City · Neighborhood crime trends

New York Bronx South

20 neighborhoods - a quarterly race to the lowest crime rate.

Crime Trends: Neighborhoods compared - each quarter from Q1 2022

New York as a whole averaged 16.5 crimes for every 1,000 residents per quarter in Q2 2026, while the south Bronx averaged 23.4 (leaving out 5 places with almost no residents), hence it is generally less safe when all crimes are considered.

How do the 20 neighborhoods of the south Bronx compare? In Q2 2026 the police recorded 15,714 crimes across them, 23.4 for every 1,000 residents. That is 11.7% below a year earlier and 17.5% above Q1 2022, the first quarter we track.

Parkchester has the lowest rate of the everyday neighborhoods (9.9 per 1,000), followed by Throgs Neck-Schuylerville (11.9) and Pelham Bay-Country Club-City Island (11.9). Hunts Point has the highest (59.0).

Use the RACE CHARTS below to watch all 20 NEW YORK BRONX SOUTH NEIGHBORHOODs race across 18 quarter periods from Q1 2022 to Q2 2026 - one crime category at a time or all together. The race chart can be used to compare average crime rates by category against New York's average.

Neighborhood boundaries are defined by NYC Department of City Planning, 2020 Neighborhood Tabulation Areas.
Lowest rate (everyday)
lowest rateParkchester
9.9 crimes per 1,000 residents, Q2 2026
Highest rate
upHunts Point
59.0 per 1,000, Q2 2026
Whole area, Q2 2026
23.4 per 1,000
down 11.7% below a year earlier · up 17.5% above Q1 2022
Compared
20 neighborhoods
671,142 residents · 18 quarters

New York Bronx South neighborhood quarterly crime race

Press ▶︎ to watch Q1 2022 to Q2 2026. Tick one crime category or several; hover a bar for the neighborhood. Property crimes includes burglaries and thefts.

Crime categories
Indicated: crimes rate per 1000 residents per quarterAll · safest at the top · square-root scale · Q1 2022 to Q2 202605255010016.1Castle Hill-Unionport20.9Claremont Village-Claremont (East)20.2Concourse-Concourse Village25.7Crotona Park East19.9Highbridge37.8Hunts Point23.9Longwood27.0Melrose23.4Morrisania25.3Mott Haven-Port Morris20.8Mount Eden-Claremont (West)10.9Parkchester8.6Pelham Bay-Country Club-City Island0.7Rikers Island18.2Soundview-Bruckner-Bronx River20.0Soundview-Clason Point210Soundview Park9.6Throgs Neck-Schuylerville21.7West Farms15.5Westchester SquareNew York Q2 2026 average all crimes (16.5)Numbers are crimes per 1,000 residents per quarter. Zero-crime quarters show 0 and rank safest. Not included, no residents: Claremont Park; Crotona Park; Ferry Point Park-St. Raymond Cemetery; North& South Brother Islands; Yankee Stadium-Macombs Dam Park.
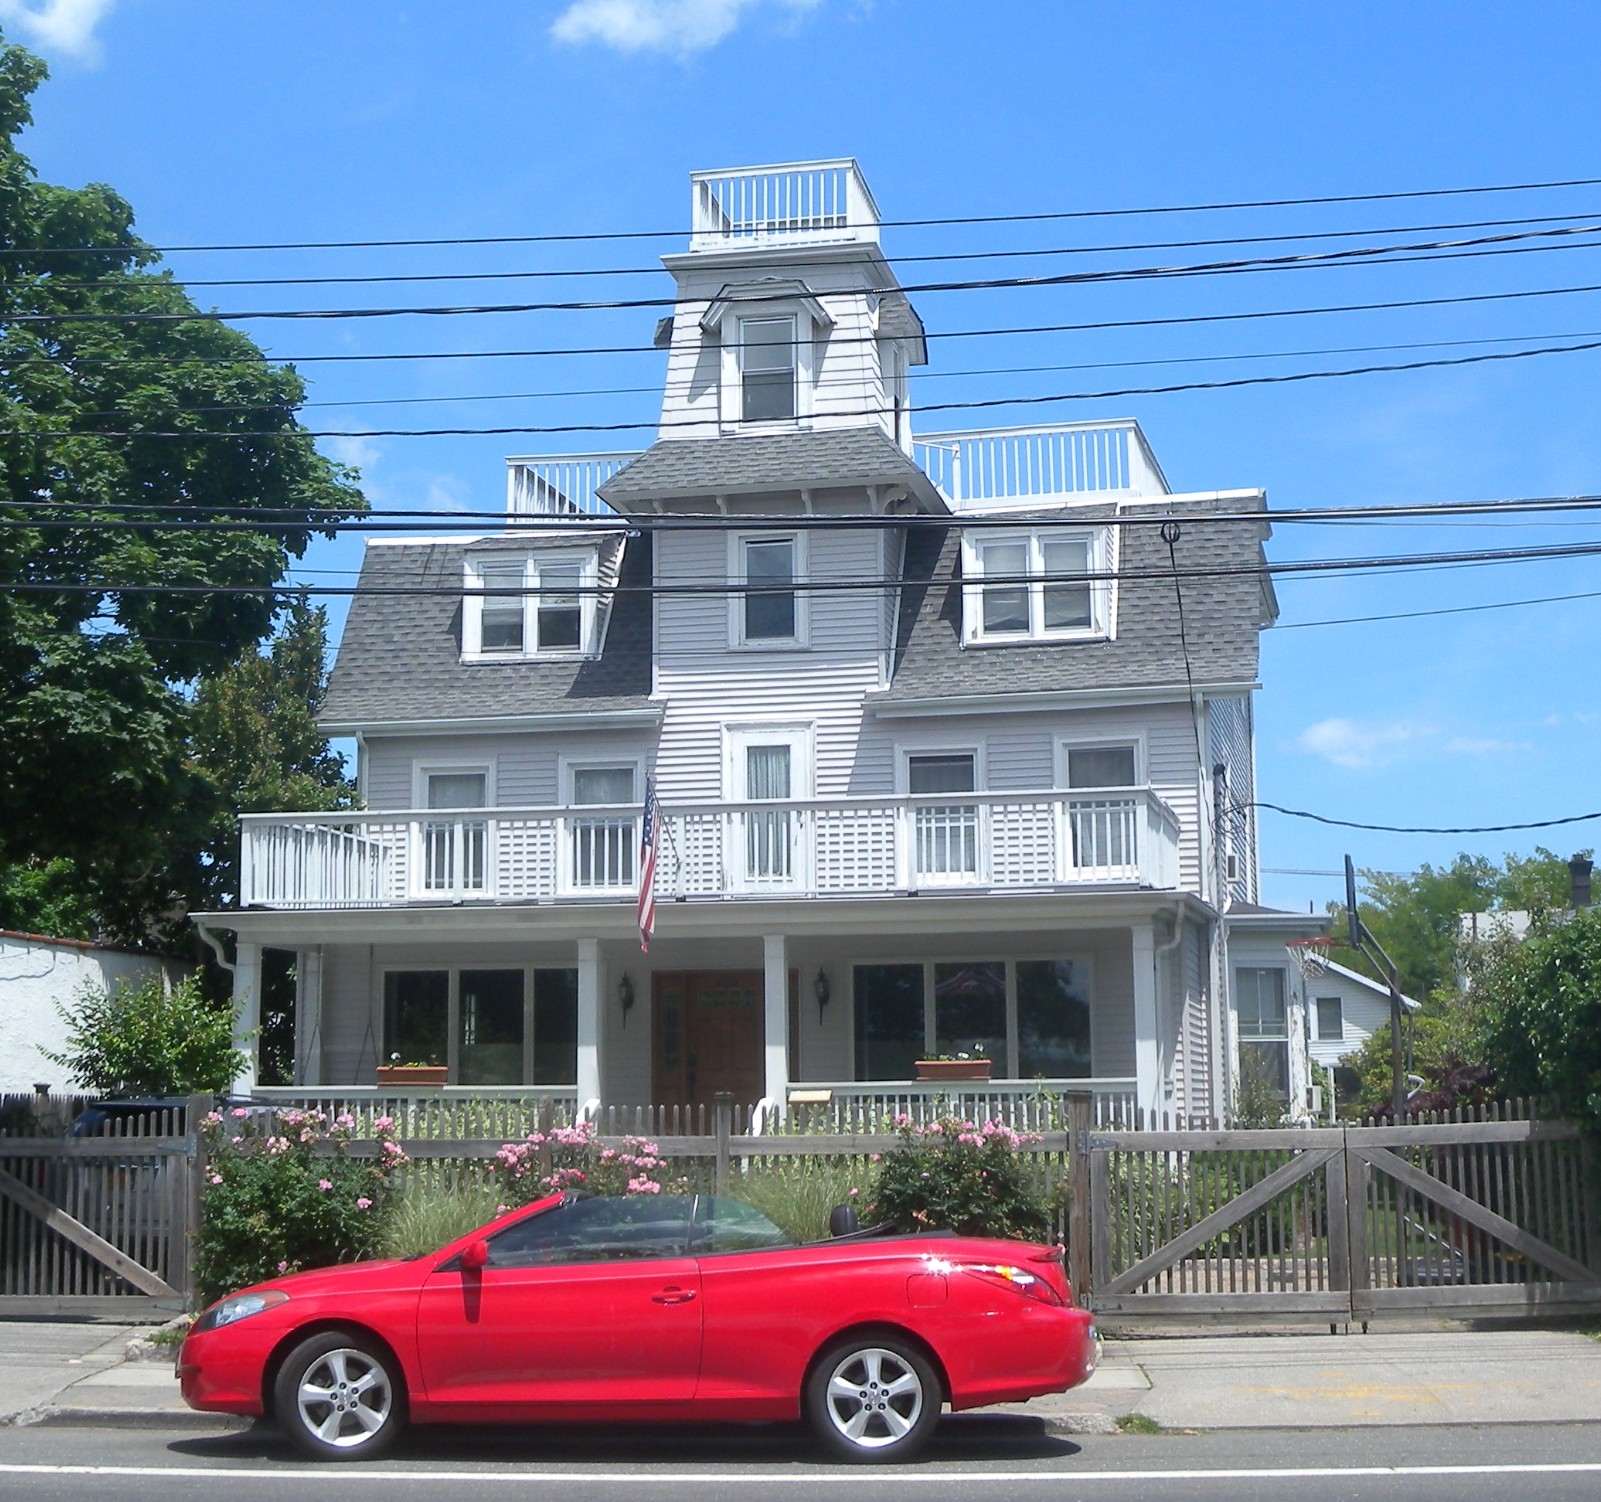
625 CI Avenue, Pelham Bay-Country Club-City Island You checked the neighborhood.Now check an address ! Photo: Jim.henderson, CC0 · Wikimedia Commons

For $34.00 a CrimesLog™ Home Report provides: (where available)

  • Nearest 6 Pre-school Nurseries to Address
  • Nearest 6 Primary Schools to Address
  • Nearest 6 Secondary/High Schools to Address
  • Nearest College and University to Address
  • Nearest to Address Medical Clinics, Hospitals and Pharmacies
  • Nearest 2 Police Station details to Address

The Home Report also provides

  • The CrimesLog™ Home Score is a proprietary Home Safety Measure capturing crime frequency, severity, recency and proximity to Address from police crime reporting point
  • A map indicating police anonymized crime reporting points around Address
  • Crime category trendlines for Address neighborhood
  • List of Reported Crime Incidents around Address radius
  • Downloadable PDF report — A Permanent Copy to Keep and Share to aid your Property Research
  • Our crimes database of almost 60 million records is UPDATED EVERY MONTH from US, UK, CA police sources
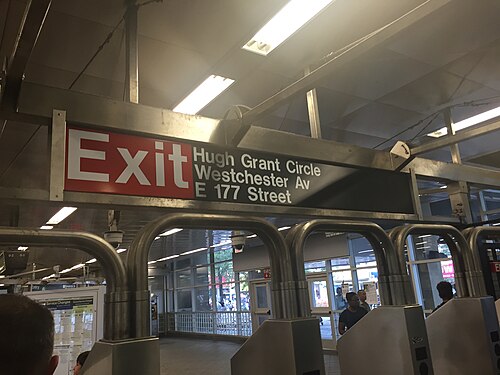
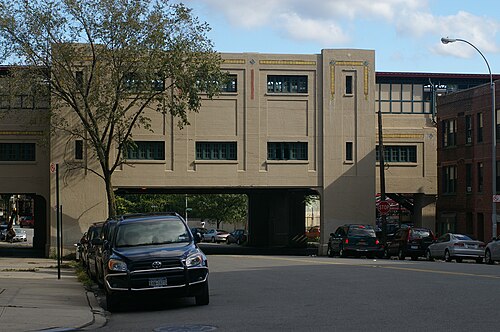
Parkchester Exit, Parkchester
Parkchester · Parkchester Exit
Photo: Darren Foreman from Surbiton, England, CC BY 2.0 · Wikimedia Commons
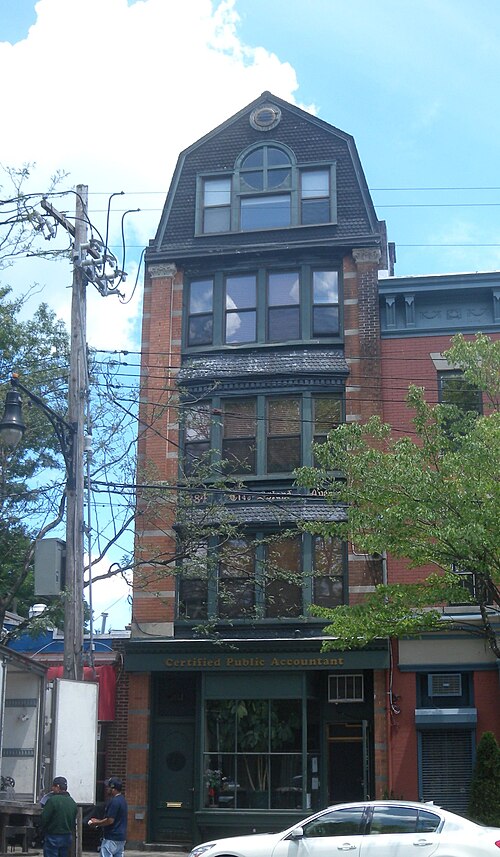
284 City Island Avenue, Pelham Bay-Country Club-City Island
Pelham Bay-Country Club-City Island · 284 City Island Avenue
Photo: Jim.henderson, CC0 · Wikimedia Commons
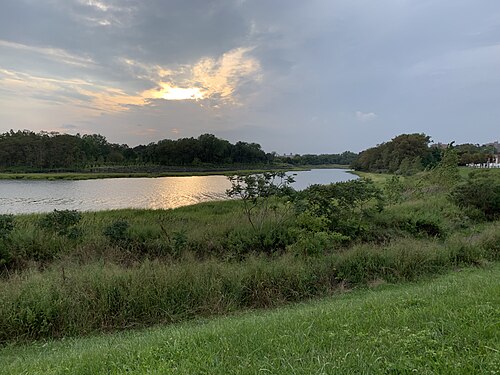
Castle Hill and Pugsley Parks, Soundview-Clason Point
Soundview-Clason Point · Castle Hill and Pugsley Parks
Photo: Gabe29, CC BY 4.0 · Wikimedia Commons
CBX Parkchester 6, Castle Hill-Unionport
Castle Hill-Unionport · CBX Parkchester 6
Photo: Jim.henderson, Public domain · Wikimedia Commons
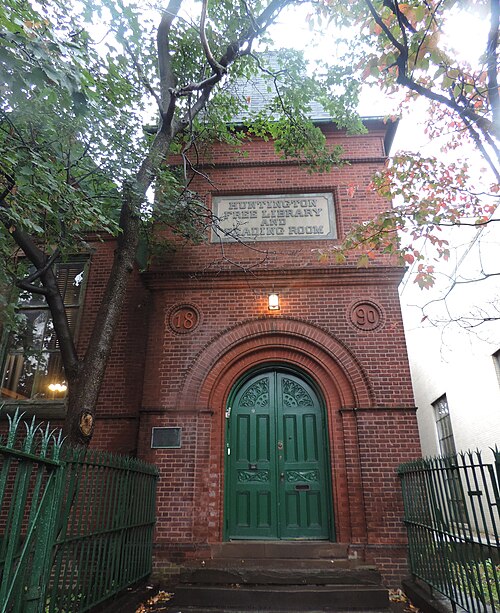
Huntington FL Front, Westchester Square
Westchester Square · Huntington FL Front
Photo: Jim.henderson, CC0 · Wikimedia Commons
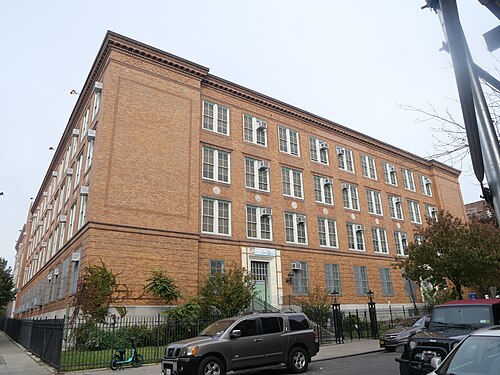
PS 536 Bx 2023, Soundview-Bruckner-Bronx River
Soundview-Bruckner-Bronx River · PS 536 Bx 2023
Photo: Jim.henderson, CC BY 4.0 · Wikimedia Commons
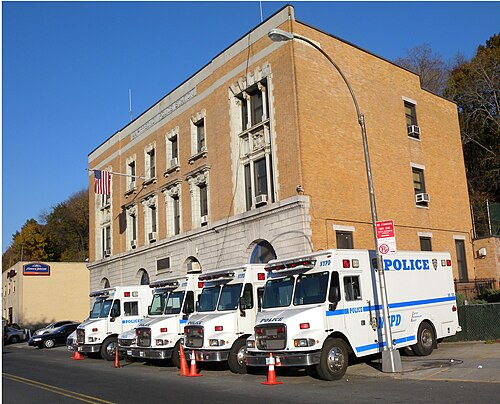
44th Precinct Sedgwick, Highbridge
Highbridge · 44th Precinct Sedgwick
Photo: Jim.henderson, CC0 · Wikimedia Commons
Bronx Park East, West Farms
West Farms · Bronx Park East
Photo: Traci Lawson from Bronx, NY, USA, CC BY 2.0 · Wikimedia Commons

How neighborhoods moved each quarter

2022

Whole-area crime rate 19.9 to 23.0 per 1,000 (high: Q3 2022).

Big moves (4+ places in a quarter): moved up Longwood 15th→11th (Q3) moved down Soundview-Clason Point 8th→13th (Q3) moved up Mount Eden-Claremont (West) 15th→9th (Q4) moved down Castle Hill-Unionport 6th→11th (Q4)

2023

Whole-area crime rate 22.9 to 24.3 per 1,000 (high: Q2 2023).

Big moves (4+ places in a quarter): moved up Castle Hill-Unionport 11th→5th (Q1) moved down Highbridge 5th→10th (Q1)

2024

Whole-area crime rate 23.8 to 26.2 per 1,000 (high: Q3 2024).

Big moves (4+ places in a quarter): moved up Crotona Park East 14th→10th (Q1) moved up West Farms 16th→12th (Q2) moved down West Farms 12th→17th (Q3) moved down Mount Eden-Claremont (West) 11th→15th (Q4)

2025

Whole-area crime rate 23.4 to 26.5 per 1,000 (high: Q2 2025).

Big moves (4+ places in a quarter): moved up Mount Eden-Claremont (West) 15th→11th (Q1) moved up Concourse-Concourse Village 15th→10th (Q4)

2026

Whole-area crime rate 22.4 to 23.4 per 1,000 (high: Q2 2026). 2 quarters so far.

Big moves (4+ places in a quarter): moved up West Farms 14th→10th (Q2)

Reported Safety Incidents

In Q2 2026: public order incidents were 40% (6,284), violent incidents were 23% (3,686), property incidents were 23% (3,683) and vehicle crimes were 9% (1,348).

Recorded crime here is grouped into violent crime, property crime (burglary and theft), vehicle crime and public order offences, so you can compare how safe each neighborhood is for the kind of crime that matters to you.

Read category comparisons with care. A category that jumps while the total hardly moves looks like a change in how offences are classified, not in what happened: Q3 2022: vehicle up 42% while the total moved 2%; Q1 2026: violent down 39% while the total moved 4%. The whole-area rate is the steadier guide.

Places we left out, and places to read with care

Left out: Claremont Park; Crotona Park; Ferry Point Park-St. Raymond Cemetery; North & South Brother Islands; Yankee Stadium-Macombs Dam Park. They have almost no residents: their crimes are against visitors, so a rate per resident says little about living there.

Rikers Island is a jail complex rather than a residential neighborhood (0.3 per 1,000 from 1 crime among 2,950 residents), so it is not named as the lowest or highest. Soundview Park is a park with only about a hundred residents and a dozen recorded crimes (114.3 per 1,000 from 12 crimes among 105 residents), so it is not named as the lowest or highest.

The 20 neighborhoods on the map

Bronx South is made of 20 neighborhoods compared here, each in its own colour on the map. They are the City Planning “Neighborhood Tabulation Areas”: 671,142 residents between them.

  • Castle Hill-Unionport
  • Claremont Village-Claremont (East)
  • Concourse-Concourse Village
  • Crotona Park East
  • Highbridge
  • Hunts Point
  • Longwood
  • Melrose
  • Morrisania
  • Mott Haven-Port Morris
  • Mount Eden-Claremont (West)
  • Parkchester
  • Pelham Bay-Country Club-City Island
  • Rikers Island
  • Soundview Park
  • Soundview-Bruckner-Bronx River
  • Soundview-Clason Point
  • Throgs Neck-Schuylerville
  • West Farms
  • Westchester Square

All 20 neighborhoods, Q2 2026

Crimes per 1,000 residents, Q2 2026, lowest first. The last two columns compare with Q1 2022.
#NeighborhoodResidentsAllViolentPropertyVehiclePublic orderRate vs Q1 2022Places gained
1Rikers Island †2,9500.30.00.00.00.0down50%–
2Parkchester29,4609.92.62.20.83.9down9%up2
3Throgs Neck-Schuylerville47,90311.92.42.22.04.9up24%–
4Pelham Bay-Country Club-City Island28,35111.92.22.51.65.3up39%down2
5Soundview-Clason Point35,61217.84.23.41.48.1down11%up4
6Castle Hill-Unionport35,83818.23.14.32.17.8up13%–
7Westchester Square14,68018.34.24.31.67.8up18%down2
8Soundview-Bruckner-Bronx River67,86919.04.25.31.76.9up4%down1
9Highbridge30,81219.25.73.81.57.2down3%down1
10West Farms18,44223.15.45.41.510.1up6%up3
11Concourse-Concourse Village67,78024.25.75.42.49.5up20%down1
12Claremont Village-Claremont (East)24,21324.55.94.52.610.0up17%–
13Longwood40,14324.85.46.21.910.0up4%up2
14Mount Eden-Claremont (West)48,39426.57.56.22.49.1up27%down3
15Crotona Park East29,48027.45.56.81.612.3up7%up2
16Morrisania37,24828.37.45.62.511.6up21%down2
17Mott Haven-Port Morris56,60033.18.57.92.412.9up31%down1
18Melrose41,04337.78.69.12.016.8up40%–
19Hunts Point14,21959.012.019.04.319.8up56%–
20Soundview Park †105114.347.619.119.119.1down45%–

† Rikers Island is a jail complex rather than a residential neighborhood; Soundview Park is a park with only about a hundred residents and a dozen recorded crimes. A rate on a very small number of residents or crimes is not comparable with the others.

Photographs

90 photographs of the 20 neighborhoods run along the reel; click one to see it full size. Each is credited here and under the large view.

All 90 photographs and their credits
  1. Parkchester · Parkchester Exit. Photo: Darren Foreman from Surbiton, England, CC BY 2.0 · Wikimedia Commons
  2. Pelham Bay-Country Club-City Island · 284 City Island Avenue. Photo: Jim.henderson, CC0 · Wikimedia Commons
  3. Soundview-Clason Point · Castle Hill and Pugsley Parks. Photo: Gabe29, CC BY 4.0 · Wikimedia Commons
  4. Castle Hill-Unionport · CBX Parkchester 6. Photo: Jim.henderson, Public domain · Wikimedia Commons
  5. Westchester Square · Huntington FL Front. Photo: Jim.henderson, CC0 · Wikimedia Commons
  6. Soundview-Bruckner-Bronx River · PS 536 Bx 2023. Photo: Jim.henderson, CC BY 4.0 · Wikimedia Commons
  7. Highbridge · 44th Precinct Sedgwick. Photo: Jim.henderson, CC0 · Wikimedia Commons
  8. West Farms · Bronx Park East. Photo: Traci Lawson from Bronx, NY, USA, CC BY 2.0 · Wikimedia Commons
  9. Concourse-Concourse Village · 161 IRT GC (IRT = Interborough Rapid Transit, a New York City subway division). Photo: Jim.henderson, CC0 · Wikimedia Commons
  10. Claremont Village-Claremont (East) · Morris Houses Park Avenue & St Pauls Place. Photo: Jim.henderson, CC0 · Wikimedia Commons
  11. Longwood · 655 Prospect Avenue Eng 73 H&L 42. Photo: Jim.henderson, CC0 · Wikimedia Commons
  12. Mount Eden-Claremont (West) · Bronxcare Bx-Leb. Photo: Jim.henderson, CC0 · Wikimedia Commons
  13. Crotona Park East · Boston Road Suburban La. Photo: Jim.henderson, Public domain · Wikimedia Commons
  14. Morrisania · CB3 Bx 1426 Boston Road 2022. Photo: Jim.henderson, CC BY 4.0 · Wikimedia Commons
  15. Mott Haven-Port Morris · Brook Avenue 6 IRT Station (IRT = Interborough Rapid Transit, a New York City subway division). Photo: Jim.henderson, Public domain · Wikimedia Commons
  16. Melrose · Casa Amadeo Prospect Avenue IRT Platform (IRT = Interborough Rapid Transit, a New York City subway division). Photo: Jim.henderson, CC0 · Wikimedia Commons
  17. Hunts Point · Athanasius Roman Catholic Church Bx. Photo: Jim.henderson, CC0 · Wikimedia Commons
  18. Soundview Park · Bronxmouth. Photo: Jim.henderson, Public domain · Wikimedia Commons
  19. Ferry Point Park-St. Raymond Cemetery · Malba from Ferry Point. Photo: MyName (Jim.henderson (talk)), Public domain · Wikimedia Commons
  20. Yankee Stadium-Macombs Dam Park · Brock Holt Batting in Game Against Yankees 09-27-16 (6). Photo: Arturo Pardavila III from Hoboken, NJ, USA, CC BY 2.0 · Wikimedia Commons
  21. Parkchester · Photo Nov 18 2025, 10 41 10 AM. Photo: Hafijur R1, CC0 · Wikimedia Commons
  22. Pelham Bay-Country Club-City Island · CI Bridge from South of Park. Photo: Jim.henderson, CC0 · Wikimedia Commons
  23. Soundview-Clason Point · Westchcreek. Photo: Jim.henderson, Public domain · Wikimedia Commons
  24. Castle Hill-Unionport · H&L 47 Ellis Avenue Bx 2023. Photo: Jim.henderson, CC BY 4.0 · Wikimedia Commons
  25. Westchester Square · Huntington FL Main Reading Room. Photo: Jim.henderson, CC0 · Wikimedia Commons
  26. Soundview-Bruckner-Bronx River · Amtrak Bridge Over Bx River Fr Westch Avenue. Photo: Jim.henderson, CC0 · Wikimedia Commons
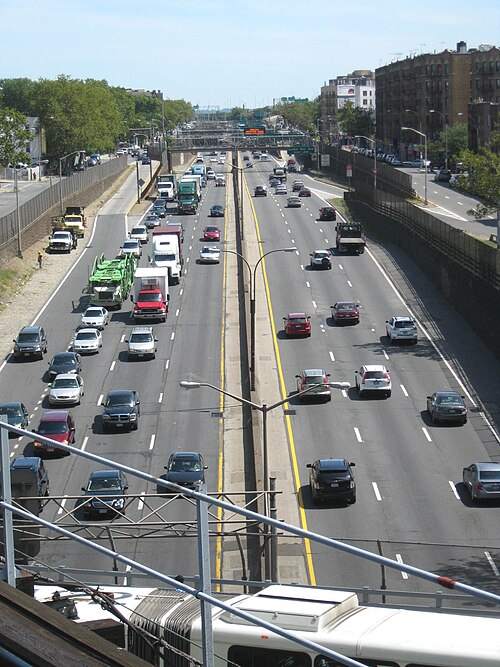
  27. Highbridge · Deegan 161. Photo: Jim.henderson, CC0 · Wikimedia Commons
  28. West Farms · East 180 St. Photo: Metropolitan Transportation Authority of the State of New York, CC BY 2.0 · Wikimedia Commons
  29. Concourse-Concourse Village · 167 IND GC Station (IND = Independent Subway System, a New York City subway division). Photo: Jim.henderson, CC0 · Wikimedia Commons
  30. Claremont Village-Claremont (East) · Grocery Shop - Dec. 1936 - Flickr - JFGryphon. Photo: Jim Griffin, CC0 · Wikimedia Commons
  31. Longwood · 41 Precinct Longwood Avenue. Photo: Jim.henderson, CC0 · Wikimedia Commons
  32. Mount Eden-Claremont (West) · Mt Eden IRT Fr GC (IRT = Interborough Rapid Transit, a New York City subway division). Photo: Jim.henderson, Public domain · Wikimedia Commons
  33. Crotona Park East · 174 IRT Station (IRT = Interborough Rapid Transit, a New York City subway division). Photo: Jim.henderson, Public domain · Wikimedia Commons
  34. Mott Haven-Port Morris · Ladder 29 Engine 83 FDNY Bx. Photo: Jim.henderson, CC0 · Wikimedia Commons
  35. Melrose · Casa Amadeo Prospect Avenue. Photo: Jim.henderson, CC0 · Wikimedia Commons
  36. Hunts Point · Amer Bank Note Tiffany Garrison. Photo: Jim.henderson, CC0 · Wikimedia Commons
  37. Soundview Park · Soundview Park Story. Photo: Jim.henderson, Public domain · Wikimedia Commons
  38. Ferry Point Park-St. Raymond Cemetery · LED Lights Installed at Bronx-Whitestone Bridge. Photo: Metropolitan Transportation Authority of the State of New York, CC BY 2.0 · Wikimedia Commons
  39. Yankee Stadium-Macombs Dam Park · Babe Ruth Lou Gehrig. Photo: Kanesue, CC BY 2.0 · Wikimedia Commons
  40. Parkchester · Photo Nov 18 2025, 10 43 44 AM. Photo: Hafijur R1, CC0 · Wikimedia Commons
  41. Pelham Bay-Country Club-City Island · 625 CI Avenue. Photo: Jim.henderson, CC0 · Wikimedia Commons
  42. Soundview-Clason Point · Clasonlagoon. Photo: Jim.henderson, Public domain · Wikimedia Commons
  43. Castle Hill-Unionport · I-678 Lafayette. Photo: Jim.henderson, Public domain · Wikimedia Commons
  44. Westchester Square · 1518 Williamsbridge Road Squad 61 FDNY. Photo: Jim.henderson, CC0 · Wikimedia Commons
  45. Soundview-Bruckner-Bronx River · Bronx River NYCHA Sun. Photo: Jim.henderson, CC0 · Wikimedia Commons
  46. Highbridge · City Prep Ogden 171. Photo: Jim.henderson, CC0 · Wikimedia Commons
  47. West Farms · East 180. Photo: Metropolitan Transportation Authority of the State of New York, CC BY 2.0 · Wikimedia Commons
  48. Concourse-Concourse Village · Bronxworks CAB 1130 GC. Photo: Jim.henderson, CC0 · Wikimedia Commons
  49. Longwood · Banana Kelly HS PS39 Longwood Avenue. Photo: Jim.henderson, CC0 · Wikimedia Commons
  50. Mount Eden-Claremont (West) · 170 St IRT Station in Rain (IRT = Interborough Rapid Transit, a New York City subway division). Photo: Jim.henderson at English Wikipedia, Public domain · Wikimedia Commons
  51. Crotona Park East · Freeman IRT Station (IRT = Interborough Rapid Transit, a New York City subway division). Photo: Jim.henderson, Public domain · Wikimedia Commons
  52. Mott Haven-Port Morris · Luke Roman Catholic Church 623 East 138th Street. Photo: Jim.henderson, CC0 · Wikimedia Commons
  53. Melrose · Elizabeth Parochial 421 E155 St Hope Line. Photo: Jim.henderson, CC0 · Wikimedia Commons
  54. Hunts Point · Amer Bank Note Tiffany Lafayette. Photo: Jim.henderson, CC0 · Wikimedia Commons
  55. Soundview Park · Sound View Point Marker 2023. Photo: Jim.henderson, CC BY 4.0 · Wikimedia Commons
  56. Ferry Point Park-St. Raymond Cemetery · LED Lights Installed at Bronx-Whitestone Bridge. Photo: Metropolitan Transportation Authority of the State of New York, CC BY 2.0 · Wikimedia Commons
  57. Yankee Stadium-Macombs Dam Park · Derek Jeter. Photo: Kanesue, CC BY 2.0 · Wikimedia Commons
  58. Parkchester · Photo Nov 18 2025, 10 39 54 AM. Photo: Hafijur R1, CC0 · Wikimedia Commons
  59. Pelham Bay-Country Club-City Island · CI Marina & Throgs Neck Br. Photo: Jim.henderson, CC0 · Wikimedia Commons
  60. Soundview-Clason Point · Harding Park Welcomes TdB. Photo: Jim.henderson, Public domain · Wikimedia Commons
  61. Soundview-Bruckner-Bronx River · Photo of NYCHA James Monroe and Clason Point Gardens Houses. Photo: Gabe29, CC BY 4.0 · Wikimedia Commons
  62. Highbridge · HW Wilson Lighthouse W162 Bx. Photo: Jim.henderson, CC0 · Wikimedia Commons
  63. West Farms · Bronx River Art Center. Photo: Jim.henderson, Public domain · Wikimedia Commons
  64. Longwood · Intervale IRT Station (IRT = Interborough Rapid Transit, a New York City subway division). Photo: Jim.henderson, Public domain · Wikimedia Commons
  65. Mount Eden-Claremont (West) · 170 IRT Fr GC (IRT = Interborough Rapid Transit, a New York City subway division). Photo: Jim.henderson, CC0 · Wikimedia Commons
  66. Crotona Park East · Freeman St IRT Station (IRT = Interborough Rapid Transit, a New York City subway division). Photo: Jim.henderson, Public domain · Wikimedia Commons
  67. Mott Haven-Port Morris · Brown Place Baptist Church Bx. Photo: Jim.henderson, CC BY 4.0 · Wikimedia Commons
  68. Hunts Point · 278overheads. Photo: User:Crispy1995, Public domain · Wikimedia Commons
  69. Soundview Park · Soundview Park Amphitheater 2023. Photo: Jim.henderson, CC BY 4.0 · Wikimedia Commons
  70. Yankee Stadium-Macombs Dam Park · Babe Ruth. Photo: Kanesue, CC BY 2.0 · Wikimedia Commons
  71. Pelham Bay-Country Club-City Island · City Island, Bronx, NY, USA. Photo: liyuhanrenll, CC BY 3.0 · Wikimedia Commons
  72. Highbridge · Depot Place from Hibridge. Photo: Jim.henderson, CC BY 3.0 · Wikimedia Commons
  73. West Farms · East 180 Side Entrance. Photo: TheTurducken, CC BY 2.0 · Wikimedia Commons
  74. Longwood · Hunts Pt Avenue 6 Station House Brick. Photo: Jim.henderson, CC0 · Wikimedia Commons
  75. Mount Eden-Claremont (West) · 170 Street Elevator. Photo: Metropolitan Transportation Authority of the State of New York from United States of America, CC BY 2.0 · Wikimedia Commons
  76. Mott Haven-Port Morris · Brook Avenue. Photo: Paul Lowry, CC BY 4.0 · Wikimedia Commons
  77. Hunts Point · Hunts Point NYPL Tiffany St Sun. Photo: Jim.henderson, CC0 · Wikimedia Commons
  78. Highbridge · Hbridge and Deegan Interchg from Tower 2023. Photo: Jim.henderson, CC BY 4.0 · Wikimedia Commons
  79. West Farms · Bronx Zoo Asia Gate Entrance August 2026. Photo: SnowFire, CC BY 4.0 · Wikimedia Commons
  80. Longwood · Kelly Street Garden 2022. Photo: BruZeines, CC0 · Wikimedia Commons
  81. Mount Eden-Claremont (West) · 170 Street Elevator 2. Photo: Metropolitan Transportation Authority of the State of New York from United States of America, CC BY 2.0 · Wikimedia Commons
  82. Hunts Point · Hunts Point NYPL 877 Southern Boulevard. Photo: Jim.henderson, CC0 · Wikimedia Commons
  83. Longwood · 5 Train Approaching Prospect Avenue June 2026. Photo: 4300streetcar, CC BY 4.0 · Wikimedia Commons
  84. Mount Eden-Claremont (West) · 170 Street Elevator 3. Photo: Metropolitan Transportation Authority of the State of New York from United States of America, CC BY 2.0 · Wikimedia Commons
  85. Hunts Point · Eternal Rock Xtian Ch 840 Intervale Avenue Southern Boulevard. Photo: Jim.henderson, CC0 · Wikimedia Commons
  86. Mount Eden-Claremont (West) · 170 Street Platform. Photo: Metropolitan Transportation Authority of the State of New York from United States of America, CC BY 2.0 · Wikimedia Commons
  87. Hunts Point · Apartment House Lafayette & HPA NE. Photo: Jim.henderson, CC0 · Wikimedia Commons
  88. Hunts Point · Amer Bank Note Lafayette Avenue & Baretto St Sun. Photo: Jim.henderson, CC0 · Wikimedia Commons
  89. Hunts Point · Hunts Point NYWB from Bruckner Boulevard Zoom. Photo: Jim.henderson, CC0 · Wikimedia Commons
  90. Hunts Point · Duane Reade HPA 163 St. Photo: Jim.henderson, CC0 · Wikimedia Commons

Sources and notes

CrimesLog sources crime incident data published by the New York City Police Department (NYPD) through the NYC Open Data Portal, containing public sector information governed by the NYC Open Data Law (Local Law 11 of 2012) and the NYC.gov Terms of Use.

Population: U.S. Census Bureau, American Community Survey 5-year estimates (public domain).

First-place medal: 1st Place Medal emoji icon by Icons8.

Neighborhood boundaries are defined by NYC Department of City Planning, 2020 Neighborhood Tabulation Areas (NYC Open Data), merged and simplified by CrimesLog. The photographs are credited under each picture.

Rates are recorded crimes per 1,000 residents, quarter by quarter; where a neighborhood has fewer than 100 residents the rate would be worked out on 100 (those places are left out of the race). A count of recorded crime is not a verdict on any neighborhood.