Montreal, Quebec · Neighborhood crime trends

Montreal

33 neighborhoods - a quarterly race to the lowest crime rate.

Crime Trends: Neighborhoods compared - each quarter from Q1 2022

How do the 33 neighborhoods of Montreal compare? In Q2 2026 the police recorded 6,468 crimes across them, 3.2 for every 1,000 residents. That is 3.3% below a year earlier and 13.2% above Q1 2022, the first quarter we track.

Hampstead has the lowest rate of the everyday neighborhoods (1.0 per 1,000), followed by Côte-Saint-Luc (1.0) and L'Île-Bizard–Sainte-Geneviève (1.3). Ville-Marie has the highest (9.2).

Use the RACE CHARTS below to watch all 33 MONTREAL NEIGHBORHOODs race across 18 quarter periods from Q1 2022 to Q2 2026 - one crime category at a time or all together.

Boundaries are defined by the Ville de Montréal (boroughs and linked cities) and simplified by CrimesLog.
Lowest rate (everyday)
lowest rateHampstead
1.0 crimes per 1,000 residents, Q2 2026
Highest rate
upVille-Marie
9.2 per 1,000, Q2 2026
Whole area, Q2 2026
3.2 per 1,000
down 3.3% below a year earlier · up 13.2% above Q1 2022
Compared
33 neighborhoods
2,004,235 residents · 18 quarters

Montreal neighborhood quarterly crime race

Press ▶︎ to watch Q1 2022 to Q2 2026. Tick one crime category or several; hover a bar for the neighborhood. Property crimes includes burglaries and thefts.

Crime categories
Indicated: crimes rate per 1000 residents per quarterAll · safest at the top · square-root scale · Q1 2022 to Q2 20260152.1Ahuntsic-Cartierville3.7Anjou1.9Baie-D'Urfé1.0Beaconsfield2.2Côte-des-Neiges–Notre-Dame-de-Grâce1.2Côte-Saint-Luc1.3Dollard-des-Ormeaux6.4Dorval0.6Hampstead1.1Kirkland0.7L'Île-Bizard–Sainte-Geneviève2.5Lachine2.4LaSalle3.2Le Plateau-Mont-Royal2.1Le Sud-Ouest3.7Mercier–Hochelaga-Maisonneuve1.5Mont-Royal4.8Montréal-Est3.9Montréal-Nord1.6Montréal-Ouest1.5Outremont1.2Pierrefonds-Roxboro2.8Pointe-Claire2.8Rivière-des-Prairies–Pointe-aux-Trembles3.0Rosemont–La Petite-Patrie3.1Saint-Laurent2.8Saint-Léonard1.4Sainte-Anne-de-Bellevue1.1Senneville2.0Verdun7.3Ville-Marie2.9Villeray–Saint-Michel–Parc-Extension1.2WestmountNumbers are crimes per 1,000 residents per quarter. Zero-crime quarters show 0 and rank safest.
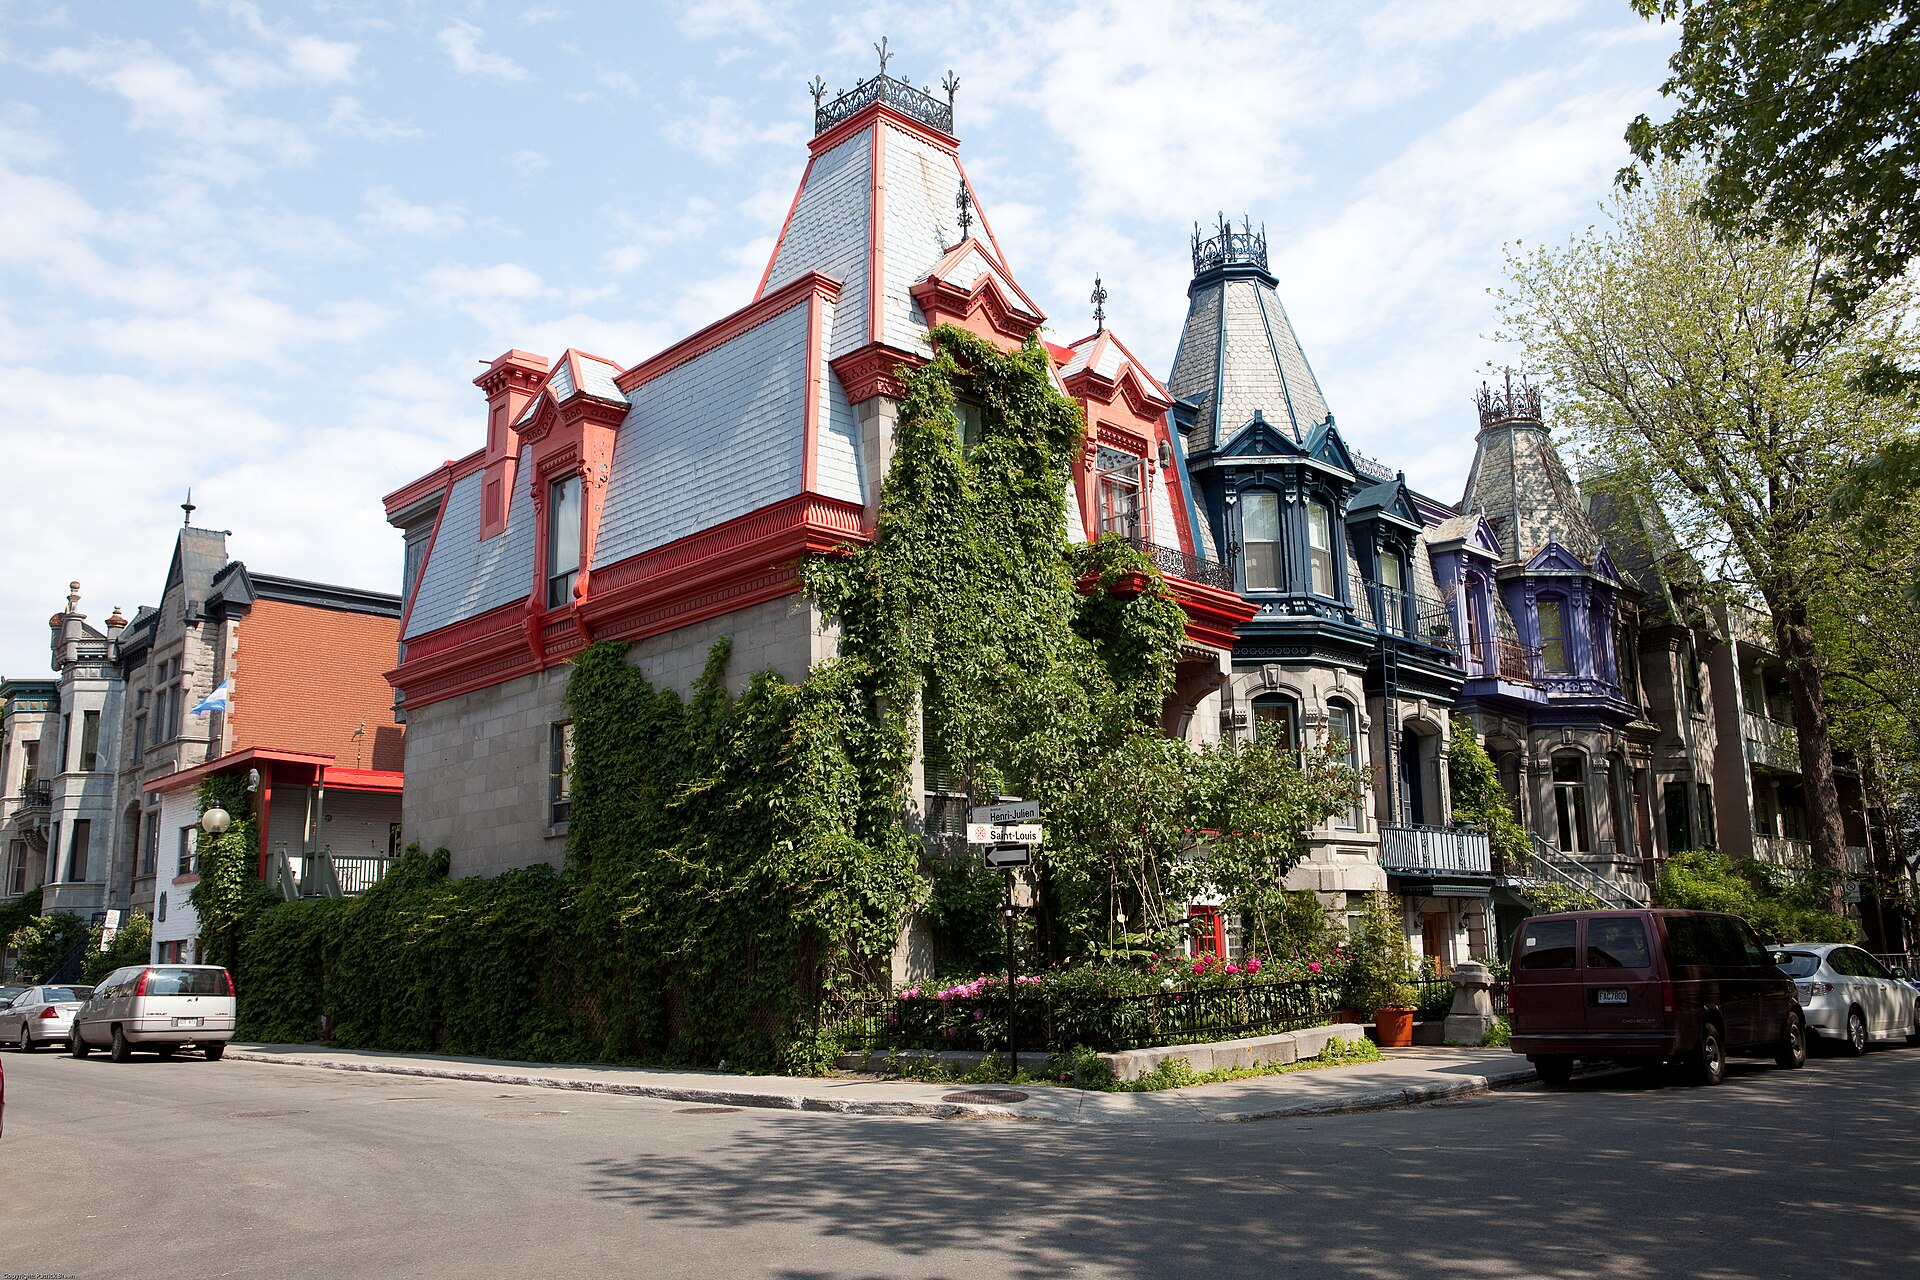
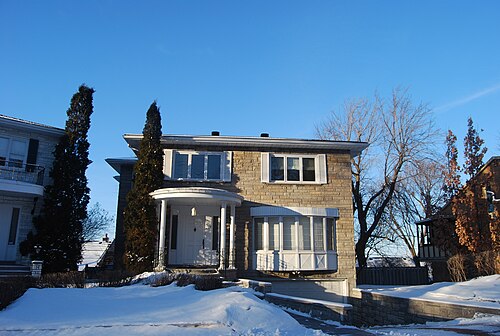
Colorful Houses, Le Plateau-Mont-Royal You checked the neighborhood.Now check an address ! Photo: Patrick from Merrimack, NH, United States, CC BY 2.0 · Wikimedia Commons

For C$40.00 a CrimesLog™ Home Report provides: (where available)

  • Nearest 6 Pre-school Nurseries to Address
  • Nearest 6 Primary Schools to Address
  • Nearest 6 Secondary/High Schools to Address
  • Nearest College and University to Address
  • Nearest to Address Medical Clinics, Hospitals and Pharmacies
  • Nearest 2 Police Station details to Address

The Home Report also provides

  • The CrimesLog™ Home Score is a proprietary Home Safety Measure capturing crime frequency, severity, recency and proximity to Address from police crime reporting point
  • A map indicating police anonymized crime reporting points around Address
  • Crime category trendlines for Address neighborhood
  • List of Reported Crime Incidents around Address radius
  • Downloadable PDF report — A Permanent Copy to Keep and Share to aid your Property Research
  • Our crimes database of almost 60 million records is UPDATED EVERY MONTH from US, UK, CA police sources
Quartier Cavendish IGA, Quartier Cavendish Bureau En Gros, Côte-Saint-Luc
Côte-Saint-Luc · Quartier Cavendish IGA, Quartier Cavendish Bureau En Gros
Photo: Bull-Doser at English Wikipedia, Public domain · Wikimedia Commons
Scotish Men's Tour to Canada 20237, Montréal-Ouest
Montréal-Ouest · Scotish Men's Tour to Canada 20237
Photo: Robbie Sproule from Montreal, Canada, CC BY 2.0 · Wikimedia Commons
John Abbott College, Sainte-Anne-de-Bellevue
Sainte-Anne-de-Bellevue · John Abbott College
Photo: Jiaqian AirplaneFan, CC BY 3.0 · Wikimedia Commons
Annunciation Parish - Paroisse de l'Annonciation, Mont-Royal
Mont-Royal · Annunciation Parish - Paroisse de l'Annonciation
Photo: Bohao Zhao, CC BY 3.0 · Wikimedia Commons
Parc Saint-Marcel, Entrée 6e Avenue, Rivière-des-Prairies–Pointe-aux-Trembles
Rivière-des-Prairies–Pointe-aux-Trembles · Parc Saint-Marcel, Entrée 6e Avenue
Photo: Ptaff, CC0 · Wikimedia Commons
Avenue Maplewood, Outremont
Outremont · Avenue Maplewood
Photo: 4net, CC BY 3.0 · Wikimedia Commons
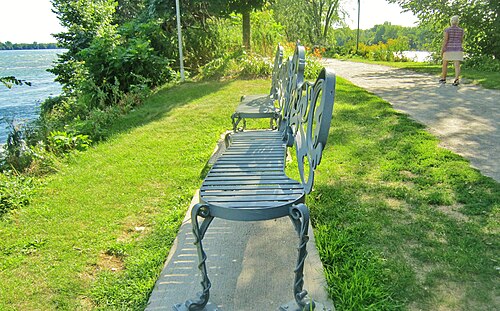
Bel Endroit Pour Une Petite Halte Au Bord Des Rapides. - If You Need a Rest with a Nice View on the Rapids of Lachine, LaSalle
LaSalle · Bel Endroit Pour Une Petite Halte Au Bord Des Rapides. - If You Need a Rest with a Nice View on the Rapids of Lachine
Photo: Richard Mc Neil, CC BY 3.0 · Wikimedia Commons
Ferme Maxwelton, 211, Rue Oakridge (Baie-D’Urfé), Baie-D'Urfé
Baie-D'Urfé · Ferme Maxwelton, 211, Rue Oakridge (Baie-D’Urfé)
Photo: Anne-Marie Dufour via Parcours riverain - Ville de Montréal from Canada, CC BY 2.0 · Wikimedia Commons

How neighborhoods moved each quarter

2022

Whole-area crime rate 2.9 to 3.8 per 1,000 (high: Q3 2022).

Big moves (4+ places in a quarter): moved up Baie-D'Urfé 14th→2nd (Q2) moved up Pierrefonds-Roxboro 8th→4th (Q2) moved up Mont-Royal 11th→5th (Q2) moved up Outremont 12th→6th (Q2) moved down L'Île-Bizard–Sainte-Geneviève 2nd→7th (Q2) moved up LaSalle 19th→9th (Q2) moved down Senneville 4th→11th (Q2) moved down Westmount 6th→12th (Q2) moved down Kirkland 5th→13th (Q2) moved up Côte-des-Neiges–Notre-Dame-de-Grâce 18th→14th (Q2) moved up Lachine 20th→16th (Q2) moved up Villeray–Saint-Michel–Parc-Extension 24th→17th (Q2) moved up Rivière-des-Prairies–Pointe-aux-Trembles 23rd→19th (Q2) moved down Sainte-Anne-de-Bellevue 10th→21st (Q2) moved up Montréal-Nord 30th→22nd (Q2) moved down Verdun 15th→24th (Q2) moved down Pointe-Claire 21st→26th (Q2) moved down Le Sud-Ouest 16th→28th (Q2) moved down Le Plateau-Mont-Royal 27th→31st (Q2) moved up Côte-Saint-Luc 8th→2nd (Q3) moved up Kirkland 13th→3rd (Q3) moved up Senneville 11th→6th (Q3) moved down Baie-D'Urfé 2nd→7th (Q3) moved up Saint-Léonard 20th→10th (Q3) moved down Mont-Royal 5th→11th (Q3) moved up Rivière-des-Prairies–Pointe-aux-Trembles 19th→13th (Q3) moved down Pierrefonds-Roxboro 4th→15th (Q3) moved up Verdun 24th→16th (Q3) moved down L'Île-Bizard–Sainte-Geneviève 7th→18th (Q3) moved down Dollard-des-Ormeaux 10th→20th (Q3) moved down Villeray–Saint-Michel–Parc-Extension 17th→21st (Q3) moved down Lachine 16th→23rd (Q3) moved down Montréal-Nord 22nd→26th (Q3) moved down Pointe-Claire 26th→30th (Q3) moved up Senneville 6th→1st (Q4) moved up Baie-D'Urfé 7th→3rd (Q4) moved up Dollard-des-Ormeaux 20th→4th (Q4) moved down Beaconsfield 1st→5th (Q4) moved up Pierrefonds-Roxboro 15th→6th (Q4) moved up Verdun 16th→7th (Q4) moved up Sainte-Anne-de-Bellevue 19th→10th (Q4) moved down Kirkland 3rd→13th (Q4) moved up L'Île-Bizard–Sainte-Geneviève 18th→14th (Q4) moved down Saint-Léonard 10th→15th (Q4) moved down Hampstead 4th→16th (Q4) moved up Montréal-Nord 26th→17th (Q4) moved down Côte-des-Neiges–Notre-Dame-de-Grâce 14th→18th (Q4) moved down Westmount 9th→19th (Q4) moved up Montréal-Est 32nd→23rd (Q4) moved down Montréal-Ouest 12th→28th (Q4)

2023

Whole-area crime rate 3.3 to 3.9 per 1,000 (high: Q3 2023).

Big moves (4+ places in a quarter): moved up Hampstead 16th→4th (Q1) moved up Mont-Royal 9th→5th (Q1) moved up Kirkland 13th→6th (Q1) moved up Montréal-Ouest 28th→9th (Q1) moved down Dollard-des-Ormeaux 4th→12th (Q1) moved down Verdun 7th→14th (Q1) moved up Rosemont–La Petite-Patrie 22nd→16th (Q1) moved down LaSalle 11th→17th (Q1) moved down Sainte-Anne-de-Bellevue 10th→19th (Q1) moved down Saint-Léonard 15th→22nd (Q1) moved down Montréal-Nord 17th→23rd (Q1) moved down Montréal-Est 23rd→32nd (Q1) moved up Beaconsfield 7th→3rd (Q2) moved up L'Île-Bizard–Sainte-Geneviève 11th→5th (Q2) moved up LaSalle 17th→8th (Q2) moved down Mont-Royal 5th→10th (Q2) moved up Sainte-Anne-de-Bellevue 19th→11th (Q2) moved up Ahuntsic-Cartierville 20th→16th (Q2) moved down Hampstead 4th→21st (Q2) moved down Senneville 1st→27th (Q2) moved up Senneville 27th→1st (Q3) moved down Baie-D'Urfé 1st→10th (Q3) moved down LaSalle 8th→13th (Q3) moved up Hampstead 21st→17th (Q3) moved down Rosemont–La Petite-Patrie 15th→21st (Q3) moved down Westmount 18th→24th (Q3) moved down Montréal-Nord 22nd→26th (Q3) moved down Mercier–Hochelaga-Maisonneuve 23rd→28th (Q3) moved up Mont-Royal 12th→3rd (Q4) moved up Hampstead 17th→4th (Q4) moved up Dollard-des-Ormeaux 11th→5th (Q4) moved down Senneville 1st→7th (Q4) moved down Outremont 5th→13th (Q4) moved down Montréal-Ouest 8th→14th (Q4) moved down Kirkland 4th→15th (Q4) moved up Westmount 24th→16th (Q4) moved down Sainte-Anne-de-Bellevue 9th→19th (Q4) moved up Montréal-Nord 26th→21st (Q4) moved down Anjou 22nd→26th (Q4)

2024

Whole-area crime rate 3.2 to 3.6 per 1,000 (high: Q3 2024).

Big moves (4+ places in a quarter): moved up Kirkland 15th→4th (Q1) moved down Mont-Royal 3rd→7th (Q1) moved up Outremont 13th→9th (Q1) moved up Sainte-Anne-de-Bellevue 19th→10th (Q1) moved down Senneville 7th→11th (Q1) moved down LaSalle 10th→14th (Q1) moved down Rivière-des-Prairies–Pointe-aux-Trembles 12th→16th (Q1) moved up Rosemont–La Petite-Patrie 23rd→18th (Q1) moved down Montréal-Ouest 14th→19th (Q1) moved up Anjou 26th→21st (Q1) moved down Baie-D'Urfé 8th→24th (Q1) moved down Montréal-Nord 21st→25th (Q1) moved down Villeray–Saint-Michel–Parc-Extension 22nd→26th (Q1) moved up Mont-Royal 7th→2nd (Q2) moved down Côte-Saint-Luc 1st→5th (Q2) moved up Baie-D'Urfé 24th→7th (Q2) moved up Montréal-Ouest 19th→15th (Q2) moved down Sainte-Anne-de-Bellevue 10th→16th (Q2) moved up Lachine 22nd→17th (Q2) moved up Villeray–Saint-Michel–Parc-Extension 26th→19th (Q2) moved down Ahuntsic-Cartierville 17th→21st (Q2) moved down Senneville 11th→24th (Q2) moved down Rosemont–La Petite-Patrie 18th→25th (Q2) moved up Pointe-Claire 31st→27th (Q2) moved up Senneville 24th→3rd (Q3) moved up Pierrefonds-Roxboro 9th→5th (Q3) moved up Sainte-Anne-de-Bellevue 16th→8th (Q3) moved down L'Île-Bizard–Sainte-Geneviève 3rd→9th (Q3) moved up Montréal-Ouest 15th→10th (Q3) moved down Mont-Royal 2nd→11th (Q3) moved down Outremont 8th→13th (Q3) moved down LaSalle 11th→17th (Q3) moved down Baie-D'Urfé 7th→18th (Q3) moved up Saint-Laurent 26th→22nd (Q3) moved down Villeray–Saint-Michel–Parc-Extension 19th→24th (Q3) moved down Ahuntsic-Cartierville 21st→25th (Q3) moved up L'Île-Bizard–Sainte-Geneviève 9th→1st (Q4) moved up Montréal-Ouest 10th→6th (Q4) moved down Senneville 3rd→10th (Q4) moved up Baie-D'Urfé 18th→12th (Q4) moved down Hampstead 4th→13th (Q4) moved up Saint-Léonard 23rd→17th (Q4) moved down Sainte-Anne-de-Bellevue 8th→18th (Q4) moved up Villeray–Saint-Michel–Parc-Extension 24th→20th (Q4) moved up Ahuntsic-Cartierville 25th→21st (Q4) moved down Lachine 19th→23rd (Q4) moved down Westmount 16th→24th (Q4)

2025

Whole-area crime rate 2.8 to 3.3 per 1,000 (high: Q2 2025).

Big moves (4+ places in a quarter): moved up Senneville 10th→1st (Q1) moved up Montréal-Ouest 6th→2nd (Q1) moved up Hampstead 13th→3rd (Q1) moved up Baie-D'Urfé 12th→7th (Q1) moved down Pierrefonds-Roxboro 4th→8th (Q1) moved down L'Île-Bizard–Sainte-Geneviève 1st→10th (Q1) moved down Kirkland 5th→11th (Q1) moved up Westmount 24th→13th (Q1) moved down Rivière-des-Prairies–Pointe-aux-Trembles 9th→18th (Q1) moved up Lachine 23rd→19th (Q1) moved up Saint-Laurent 25th→20th (Q1) moved down Sainte-Anne-de-Bellevue 18th→23rd (Q1) moved up Pointe-Claire 32nd→26th (Q1) moved down Montréal-Nord 19th→28th (Q1) moved up L'Île-Bizard–Sainte-Geneviève 10th→2nd (Q2) moved down Montréal-Ouest 2nd→8th (Q2) moved up Verdun 16th→11th (Q2) moved down Senneville 1st→12th (Q2) moved up Rivière-des-Prairies–Pointe-aux-Trembles 18th→14th (Q2) moved up Anjou 25th→16th (Q2) moved up Sainte-Anne-de-Bellevue 23rd→18th (Q2) moved down Westmount 13th→20th (Q2) moved down Saint-Léonard 15th→24th (Q2) moved up Montréal-Est 32nd→27th (Q2) moved up Côte-Saint-Luc 7th→3rd (Q3) moved up Montréal-Ouest 8th→4th (Q3) moved up Sainte-Anne-de-Bellevue 18th→5th (Q3) moved down L'Île-Bizard–Sainte-Geneviève 2nd→7th (Q3) moved down Mont-Royal 3rd→9th (Q3) moved down Pierrefonds-Roxboro 6th→12th (Q3) moved up Saint-Laurent 23rd→17th (Q3) moved up Saint-Léonard 24th→20th (Q3) moved down Anjou 16th→21st (Q3) moved up Pointe-Claire 26th→22nd (Q3) moved up Montréal-Nord 28th→24th (Q3) moved down Senneville 12th→31st (Q3) moved down Montréal-Est 27th→32nd (Q3) moved up Senneville 31st→1st (Q4) moved down Hampstead 1st→5th (Q4) moved down Sainte-Anne-de-Bellevue 5th→10th (Q4) moved down L'Île-Bizard–Sainte-Geneviève 7th→12th (Q4) moved up Montréal-Nord 24th→19th (Q4) moved down Côte-des-Neiges–Notre-Dame-de-Grâce 16th→21st (Q4) moved down Ahuntsic-Cartierville 19th→26th (Q4)

2026

Whole-area crime rate 2.6 to 3.2 per 1,000 (high: Q2 2026). 2 quarters so far.

Big moves (4+ places in a quarter): moved up Montréal-Ouest 7th→2nd (Q1) moved up Sainte-Anne-de-Bellevue 10th→5th (Q1) moved up Dollard-des-Ormeaux 14th→10th (Q1) moved up Rivière-des-Prairies–Pointe-aux-Trembles 18th→12th (Q1) moved down Kirkland 8th→13th (Q1) moved down Pierrefonds-Roxboro 11th→15th (Q1) moved up Ahuntsic-Cartierville 26th→18th (Q1) moved down L'Île-Bizard–Sainte-Geneviève 12th→19th (Q1) moved up Westmount 24th→20th (Q1) moved down Lachine 16th→24th (Q1) moved up Hampstead 6th→1st (Q2) moved up L'Île-Bizard–Sainte-Geneviève 19th→3rd (Q2) moved up Kirkland 13th→6th (Q2) moved down Baie-D'Urfé 7th→13th (Q2) moved up Lachine 24th→17th (Q2) moved up Rosemont–La Petite-Patrie 26th→21st (Q2) moved down Senneville 4th→23rd (Q2) moved down Westmount 20th→25th (Q2) moved down Saint-Laurent 21st→26th (Q2)

Reported Safety Incidents

In Q2 2026: vehicle crimes were 51% (3,275), property incidents were 22% (1,443), public order incidents were 21% (1,339) and violent incidents were 6% (411).

Recorded crime here is grouped into violent crime, property crime (burglary and theft), vehicle crime and public order offences, so you can compare how safe each neighborhood is for the kind of crime that matters to you.

Places we left out, and places to read with care

No place is left out: every neighborhood in this race has residents to count.

Senneville (3.1 per 1,000 from 3 crimes among 951 residents) is a place with few residents (under 3,000): a rate on so few people says little about living there, so it is not named as the lowest or highest.

The 33 neighborhoods on the map

Montreal is made of 33 neighborhoods compared here, each in its own colour on the map. They are the boroughs and linked cities of Montréal: 2,004,235 residents between them.

  • Ahuntsic-Cartierville
  • Anjou
  • Baie-D'Urfé
  • Beaconsfield
  • Côte-des-Neiges–Notre-Dame-de-Grâce
  • Côte-Saint-Luc
  • Dollard-des-Ormeaux
  • Dorval
  • Hampstead
  • Kirkland
  • L'Île-Bizard–Sainte-Geneviève
  • Lachine
  • LaSalle
  • Le Plateau-Mont-Royal
  • Le Sud-Ouest
  • Mercier–Hochelaga-Maisonneuve
  • Mont-Royal
  • Montréal-Est
  • Montréal-Nord
  • Montréal-Ouest
  • Outremont
  • Pierrefonds-Roxboro
  • Pointe-Claire
  • Rivière-des-Prairies–Pointe-aux-Trembles
  • Rosemont–La Petite-Patrie
  • Saint-Laurent
  • Saint-Léonard
  • Sainte-Anne-de-Bellevue
  • Senneville
  • Verdun
  • Ville-Marie
  • Villeray–Saint-Michel–Parc-Extension
  • Westmount

All 33 neighborhoods, Q2 2026

Crimes per 1,000 residents, Q2 2026, lowest first. The last two columns compare with Q1 2022.
#NeighborhoodResidentsAllViolentPropertyVehiclePublic orderRate vs Q1 2022Places gained
1Hampstead7,0371.00.00.10.70.1up74%–
2Côte-Saint-Luc34,5041.00.00.30.50.2down15%up5
3L'Île-Bizard–Sainte-Geneviève18,8851.30.10.30.70.3up78%down1
4Beaconsfield19,2771.40.00.10.80.4up36%down1
5Montréal-Ouest5,1151.40.00.40.60.4down12%up8
6Kirkland19,4131.40.00.40.70.4up27%down1
7Sainte-Anne-de-Bellevue5,0271.60.20.20.80.4up14%up3
8Mont-Royal20,9531.60.10.60.80.2up9%up3
9Rivière-des-Prairies–Pointe-aux-Trembles107,9411.80.10.30.90.4down36%up14
10Outremont24,6291.90.00.61.00.3up30%up2
11Dollard-des-Ormeaux48,4032.00.00.41.20.3up53%down2
12LaSalle82,2352.00.20.50.70.6down15%up7
13Baie-D'Urfé3,7642.10.00.51.10.5up15%up1
14Pierrefonds-Roxboro69,9062.20.10.61.20.3up80%down6
15Verdun70,3772.30.10.51.10.6up18%–
16Saint-Léonard80,0362.40.10.31.30.6down16%up6
17Lachine46,4282.40.20.71.00.5down4%up3
18Ahuntsic-Cartierville135,3362.70.20.41.60.5up27%down1
19Montréal-Nord88,4712.80.30.41.50.6down27%up11
20Côte-des-Neiges–Notre-Dame-de-Grâce170,5832.90.20.81.30.6up27%down2
21Rosemont–La Petite-Patrie141,8132.90.20.81.20.6down5%up4
22Anjou43,2433.00.10.61.60.7down18%up7
23Senneville †9513.10.03.10.00.0up200%down19
24Villeray–Saint-Michel–Parc-Extension145,0903.30.20.71.80.5up12%–
25Westmount19,6583.30.10.62.00.7up183%down19
26Saint-Laurent102,5803.30.20.51.90.7up6%–
27Mercier–Hochelaga-Maisonneuve140,0863.50.20.91.50.9down6%up1
28Pointe-Claire33,4883.80.10.42.80.5up39%down7
29Le Sud-Ouest84,5534.50.11.32.11.0up116%down13
30Dorval19,3024.50.20.73.20.5down30%up2
31Montréal-Est4,3944.50.01.41.81.4down5%–
32Le Plateau-Mont-Royal105,8135.50.41.62.70.8up73%down5
33Ville-Marie104,9449.20.71.94.62.1up26%–

† Senneville is a place with few residents. A rate on a very small number of residents or crimes is not comparable with the others.

Photographs

65 photographs of the 33 neighborhoods run along the reel; click one to see it full size. Each is credited here and under the large view.

All 65 photographs and their credits
  1. Côte-Saint-Luc · Quartier Cavendish IGA, Quartier Cavendish Bureau En Gros. Photo: Bull-Doser at English Wikipedia, Public domain · Wikimedia Commons
  2. Montréal-Ouest · Scotish Men's Tour to Canada 20237. Photo: Robbie Sproule from Montreal, Canada, CC BY 2.0 · Wikimedia Commons
  3. Sainte-Anne-de-Bellevue · John Abbott College. Photo: Jiaqian AirplaneFan, CC BY 3.0 · Wikimedia Commons
  4. Mont-Royal · Annunciation Parish - Paroisse de l'Annonciation. Photo: Bohao Zhao, CC BY 3.0 · Wikimedia Commons
  5. Rivière-des-Prairies–Pointe-aux-Trembles · Parc Saint-Marcel, Entrée 6e Avenue. Photo: Ptaff, CC0 · Wikimedia Commons
  6. Outremont · Avenue Maplewood. Photo: 4net, CC BY 3.0 · Wikimedia Commons
  7. LaSalle · Bel Endroit Pour Une Petite Halte Au Bord Des Rapides. - If You Need a Rest with a Nice View on the Rapids of Lachine. Photo: Richard Mc Neil, CC BY 3.0 · Wikimedia Commons
  8. Baie-D'Urfé · Ferme Maxwelton, 211, Rue Oakridge (Baie-D’Urfé). Photo: Anne-Marie Dufour via Parcours riverain - Ville de Montréal from Canada, CC BY 2.0 · Wikimedia Commons
  9. Pierrefonds-Roxboro · REM Sunnybrooke 2025-12-18 Station. Photo: One of Many Tims, CC BY 4.0 · Wikimedia Commons
  10. Verdun · Vue Aérienne Du Terrain de l'Institut Universitaire En Santé Mentale Douglas, Montréal, Québec, Canada. Photo: Maxime Laterreur, CC BY 4.0 · Wikimedia Commons
  11. Lachine · St. Basil the Great Ukrainian Catholic Church, Montreal - 2025 - 01. Photo: Amakuha, CC BY 4.0 · Wikimedia Commons
  12. Ahuntsic-Cartierville · Buildings Next to Highway 40. Photo: Jiaqian AirplaneFan, CC BY 3.0 · Wikimedia Commons
  13. Montréal-Nord · Montréal-Nord, Montreal, QC, Canada. Photo: Richard Mc Neil, CC BY 3.0 · Wikimedia Commons
  14. Côte-des-Neiges–Notre-Dame-de-Grâce · St. Ansgar's Lutheran Church, Montreal - 2025 - 3. Photo: Amakuha, CC BY 4.0 · Wikimedia Commons
  15. Rosemont–La Petite-Patrie · Montréal, 17 Nov. 2010. Le 6220, 5è. Avenue.. Photo: Philippe Du Berger from Montréal, CC BY 2.0 · Wikimedia Commons
  16. Villeray–Saint-Michel–Parc-Extension · School. Photo: Mike Goren from Portland, USA, CC BY 2.0 · Wikimedia Commons
  17. Westmount · Westmount-Vue Vers Le Nord Sur L'avenue Wood (Entre Maisonneuve Ouest Et Sherbrooke)-2024-11-20. Photo: Veillg1, CC0 · Wikimedia Commons
  18. Saint-Laurent · Bois-Franc Alexis-Nihon. Photo: Jean-Philippe Boulet, CC BY 3.0 · Wikimedia Commons
  19. Mercier–Hochelaga-Maisonneuve · Montreal Olympic Park 7. Photo: Tony Hisgett from Birmingham, UK, CC BY 2.0 · Wikimedia Commons
  20. Pointe-Claire · New House Built at Pointe-Claire in 2012. Photo: Jiaqian AirplaneFan, CC BY 3.0 · Wikimedia Commons
  21. Le Sud-Ouest · Holy Ghost Ukrainian Catholic Church, Montreal - 2025 - 01. Photo: Amakuha, CC BY 4.0 · Wikimedia Commons
  22. Le Plateau-Mont-Royal · Colorful Houses. Photo: Patrick from Merrimack, NH, United States, CC BY 2.0 · Wikimedia Commons
  23. Ville-Marie · Ice Hotel View from Outside. Photo: Jiaqian AirplaneFan, CC BY 3.0 · Wikimedia Commons
  24. Sainte-Anne-de-Bellevue · John Abbott College Yard. Photo: Jiaqian AirplaneFan, CC BY 3.0 · Wikimedia Commons
  25. Rivière-des-Prairies–Pointe-aux-Trembles · Piste Cyclable Du Boulevard Maurice-Duplessis, Rivière-des-Prairies–Pointe-aux-Trembles, Montréal, Québec, Canada. Photo: Maxime Laterreur, CC BY 4.0 · Wikimedia Commons
  26. Outremont · Montreal - Eglise - Boulevard Mont-Royal. Photo: Edgar El, CC BY 3.0 · Wikimedia Commons
  27. LaSalle · Au Bout Du Parc de Rapides de Lachine, Lasalle, Montréal, Québec. Photo: Richard Mc Neil, CC BY 3.0 · Wikimedia Commons
  28. Pierrefonds-Roxboro · REM Pierrefonds-Roxboro 2025-12-18 Station. Photo: One of Many Tims, CC BY 4.0 · Wikimedia Commons
  29. Lachine · St. Basil the Great Ukrainian Catholic Church, Montreal - 2025 - 02. Photo: Amakuha, CC BY 4.0 · Wikimedia Commons
  30. Ahuntsic-Cartierville · La Jolie Maison Du Boul. Gouin En Hiver. - A Winter View of the Nice House in Ahuntsic, Montreal. Photo: Richard Mc Neil, CC BY 3.0 · Wikimedia Commons
  31. Montréal-Nord · Cascades Du Barrage de Rivière Des Prairies, Île de la Visitation, Montréal. Photo: Richard Mc Neil, CC BY 3.0 · Wikimedia Commons
  32. Côte-des-Neiges–Notre-Dame-de-Grâce · House in Avenue Connaught (Montréal). Photo: Robbie Sproule from Montreal, Canada, CC BY 2.0 · Wikimedia Commons
  33. Rosemont–La Petite-Patrie · Montréal, 17 Nov. 2010. Le 6241, 5è. Avenue.. Photo: Philippe Du Berger from Montréal, CC BY 2.0 · Wikimedia Commons
  34. Villeray–Saint-Michel–Parc-Extension · Centre Justice Et Foi. Photo: Miguel Tremblay, CC0 · Wikimedia Commons
  35. Westmount · Westmont (Québec)-vue Vers Le Sud Sur L'avenue Wood (Entre Rue Sherbrooke Et Maisonneuve Ouest)-2024-11-20. Photo: Veillg1, CC0 · Wikimedia Commons
  36. Saint-Laurent · Canadair Usine St-Laurent. Photo: Pierre cb, Public domain · Wikimedia Commons
  37. Mercier–Hochelaga-Maisonneuve · Montréal, Caserne de Pompiers 03 Il S’agit Il S’agit de la Plus Vieille Station de Pompe Du Quartier Mercier Ouest. Photo: Héron du fleuve, CC0 · Wikimedia Commons
  38. Pointe-Claire · Church Overlooking the Lake in Pointe-Claire, Lac Saint-Louis. Église À Pointe-Claire. Photo: Richard Mc Neil, CC BY 3.0 · Wikimedia Commons
  39. Le Sud-Ouest · Montréal, 2009. Perspective Sur Avenue de l'Église, Vers l'Ouest, Depuis Rue Eadie.. Photo: Philippe Du Berger from Montréal, CC BY 2.0 · Wikimedia Commons
  40. Le Plateau-Mont-Royal · Avenue Bernard. Photo: GuyofMshire, CC BY 4.0 · Wikimedia Commons
  41. Ville-Marie · Avenue Du Parc. Photo: Serge Melki from Indianapolis, USA, CC BY 2.0 · Wikimedia Commons
  42. Rivière-des-Prairies–Pointe-aux-Trembles · Gare Anjou 2026-03-22 Voie 1. Photo: One of Many Tims, CC BY 4.0 · Wikimedia Commons
  43. LaSalle · Le Saint-Laurent Se Jette Dans Les Rapides de Lachine - The Rapids Start Here.... Photo: Richard Mc Neil, CC BY 3.0 · Wikimedia Commons
  44. Pierrefonds-Roxboro · Chaumont Corner Bastien Street. Photo: gueco8288, CC BY 3.0 · Wikimedia Commons
  45. Ahuntsic-Cartierville · Maison Du Maire Construite Vers 1835 Boul. Gouin, Montréal. House of Antoine Brousseau Mayor of the Sault, 1860-1864 - P. Photo: Richard Mc Neil, CC BY 3.0 · Wikimedia Commons
  46. Montréal-Nord · Barrage d'Hydro-Québec, Rivière Des Prairies, Montréal, Québec, Canada. Photo: Richard Mc Neil, CC BY 3.0 · Wikimedia Commons
  47. Côte-des-Neiges–Notre-Dame-de-Grâce · REM Canora 2025-12-18 Portillons Fenêtre. Photo: One of Many Tims, CC BY 4.0 · Wikimedia Commons
  48. Rosemont–La Petite-Patrie · St. John Berchmans Catholic Church, Montreal - 2025 - 1. Photo: Amakuha, CC BY 4.0 · Wikimedia Commons
  49. Villeray–Saint-Michel–Parc-Extension · Uniprix Stadium, Montreal, Canada (Unsplash 59RO7TskIOk). Photo: Jp Valery jpvalery, CC0 · Wikimedia Commons
  50. Westmount · Temple Emanu-El-Beth Sholom, Westmount, Sep 15 2022. Photo: D. Benjamin Miller, CC0 · Wikimedia Commons
  51. Saint-Laurent · Montréal Ville Saint-Laurent, 28 Avril 2011. Chemin de la Côte-Vertu.. Photo: Philippe Du Berger from Montréal, CC BY 2.0 · Wikimedia Commons
  52. Le Plateau-Mont-Royal · Avenue Laurier. Outremont.. Photo: 4net, CC BY 3.0 · Wikimedia Commons
  53. Rivière-des-Prairies–Pointe-aux-Trembles · Gare Anjou 2026-03-22 Entrée Quai 1 Ouest. Photo: One of Many Tims, CC BY 4.0 · Wikimedia Commons
  54. Pierrefonds-Roxboro · Chaumont. Photo: gueco8288, CC BY 3.0 · Wikimedia Commons
  55. Ahuntsic-Cartierville · An Other Little Beauty on Gouin Street, Montreal. Une Autre Petite Perle Du Sault-au-récollet. Photo: Richard Mc Neil, CC BY 3.0 · Wikimedia Commons
  56. Rosemont–La Petite-Patrie · Assumption of the Blessed Virgin Mary Ukrainian Catholic Church, Montreal - 2025 - 01. Photo: Amakuha, CC BY 4.0 · Wikimedia Commons
  57. Villeray–Saint-Michel–Parc-Extension · Rayonnage Pour Nouveaux Arrivants. Photo: SabrinaMacGrg, CC0 · Wikimedia Commons
  58. Westmount · Dawson College 3. Photo: Hayden Soloviev, CC BY 4.0 · Wikimedia Commons
  59. Le Plateau-Mont-Royal · Avenue Laurier. Outremont. - Panoramio - 4net. Photo: 4net, CC BY 3.0 · Wikimedia Commons
  60. Rivière-des-Prairies–Pointe-aux-Trembles · Gare Anjou 2026-03-22 Entrée Quai 1 Est. Photo: One of Many Tims, CC BY 4.0 · Wikimedia Commons
  61. Ahuntsic-Cartierville · Maison Mère Des Soeurs de Miséricorde, 12435, Avenue de la Miséricorde (Ahuntsic-Cartierville). Photo: Parcours riverain - Ville de Montréal from Canada, CC BY 2.0 · Wikimedia Commons
  62. Rosemont–La Petite-Patrie · Montréal, 17 Nov. 2010. Le 6208, 5è. Avenue.. Photo: Philippe Du Berger from Montréal, CC BY 2.0 · Wikimedia Commons
  63. Ahuntsic-Cartierville · 27 Novembre 2010 (K5 01679). Photo: Emmanuel Huybrechts from Laval, Canada, CC BY 2.0 · Wikimedia Commons
  64. Ahuntsic-Cartierville · Promenade Fleury - 27 Novembre 2010 (K5 01678). Photo: Emmanuel Huybrechts from Laval, Canada, CC BY 2.0 · Wikimedia Commons
  65. Ahuntsic-Cartierville · 27 Novembre 2010 (K5 01690). Photo: Emmanuel Huybrechts from Laval, Canada, CC BY 2.0 · Wikimedia Commons

Sources and notes

CrimesLog sources crime incident data originated by the Service de police de la Ville de Montréal (SPVM) and published through the City of Montréal Open Data Portal under the Open Data Licence – City of Montréal.

Contains information licensed under the Open Government Licence – Canada. Source: Statistics Canada, 2021 Census of Population.

First-place medal: 1st Place Medal emoji icon by Icons8.

Boundaries are the boroughs and linked cities defined by the Ville de Montréal and simplified by CrimesLog. The photographs are credited under each picture.

Rates are recorded crimes per 1,000 residents, quarter by quarter; where a neighborhood has fewer than 100 residents the rate would be worked out on 100 (those places are left out of the race). A count of recorded crime is not a verdict on any neighborhood.