London · Neighbourhood crime trends

London Merton

20 neighbourhoods - a quarterly race to the lowest crime rate.

Crime Trends: Neighbourhoods compared - each quarter from Q1 2023

London as a whole averaged 28.0 crimes for every 1,000 residents per quarter in Q2 2026, while Merton averaged 17.9, hence it is generally safer when all crimes are considered.

How do the 20 neighbourhoods of Merton compare? In Q2 2026 the police recorded 3,987 crimes across them, 17.9 for every 1,000 residents. That is 7.1% below a year earlier and 7.0% above Q1 2023, the first quarter we track.

Dundonald Road has the lowest rate of the everyday neighbourhoods (7.5 per 1,000), followed by Merton Park (7.8) and South Merton (8.4). Morden has the highest (41.9).

Use the RACE CHARTS below to watch all 20 LONDON MERTON NEIGHBOURHOODs race across 14 quarter periods from Q1 2023 to Q2 2026 - one crime category at a time or all together. The race chart can be used to compare average crime rates by category against London's average.

Neighbourhood areas derived by CrimesLog from rail station locations (NaPTAN, Department for Transport) and OS Open Names. Contains OS data © Crown copyright and database right 2024; contains public sector information licensed under the Open Government Licence v3.0.
Lowest rate (everyday)
lowest rateDundonald Road
7.5 crimes per 1,000 residents, Q2 2026
Highest rate
upMorden
41.9 per 1,000, Q2 2026
Whole area, Q2 2026
17.9 per 1,000
down 7.1% below a year earlier · up 7.0% above Q1 2023
Compared
20 neighbourhoods
222,902 residents · 14 quarters

London Merton neighbourhood quarterly crime race

Press ▶︎ to watch Q1 2023 to Q2 2026. Tick one crime category or several; hover a bar for the neighbourhood. Property crimes includes burglaries and thefts.

Crime categories
Indicated: crimes rate per 1000 residents per quarterAll · safest at the top · square-root scale · Q1 2023 to Q2 2026015102517.0Beddington Lane18.5Belgrave Walk20.6Colliers Wood7.7Dundonald Road14.6Haydons Road9.7Merton Park16.2Mitcham16.9Mitcham Eastfields34.0Morden17.2Morden Road13.5Morden South13.3Motspur Park14.3Phipps Bridge12.6Raynes Park9.2South Merton17.5South Wimbledon17.2Tooting40.7Wimbledon12.9Wimbledon Chase18.6Wimbledon ParkLondon Q2 2026 average all crimes (28.0)Numbers are crimes per 1,000 residents per quarter. Zero-crime quarters show 0 and rank safest.
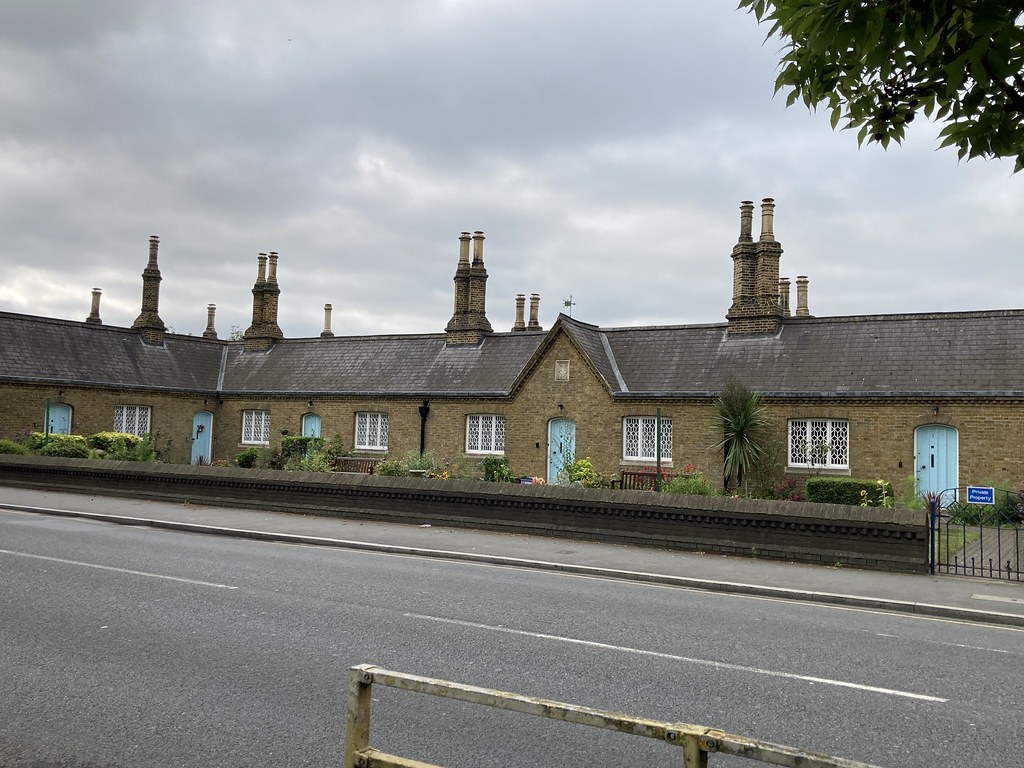
Mary Tate's Cottages, Mitcham You checked the neighbourhood.Now check an address ! Photo: Matt From London, CC BY 2.0 · Flickr

For £24.99 a CrimesLog™ Home Report provides: (where available)

  • Nearest 6 Pre-school Nurseries to Address
  • Nearest 6 Primary Schools to Address
  • Nearest 6 Secondary/High Schools to Address
  • Nearest College and University to Address
  • Nearest to Address GP Practice/Health Centres, Hospitals and Pharmacies
  • Nearest 2 Police Station details to Address

The Home Report also provides

  • The CrimesLog™ Home Score is a proprietary Home Safety Measure capturing crime frequency, severity, recency and proximity to Address from police crime reporting point
  • A map indicating police anonymised crime reporting points around Address
  • Crime category trendlines for Address neighbourhood
  • List of Reported Crime Incidents around Address radius
  • Downloadable PDF report — A Permanent Copy to Keep and Share to aid your Property Research
  • Our crimes database of almost 60 million records is UPDATED EVERY MONTH from US, UK, CA police sources
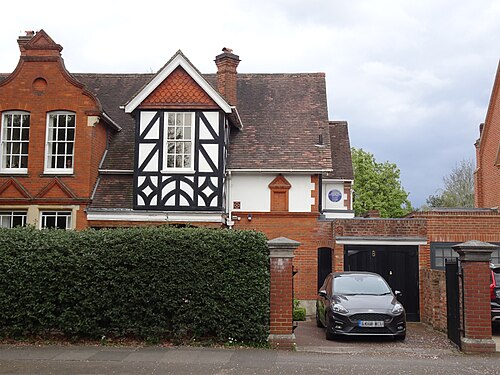
GRAHAM SUTHERLAND Blue Plaque House - 8 Dorset Road, Merton Park, London, SW19 3HA, Merton Park
Merton Park · GRAHAM SUTHERLAND Blue Plaque House - 8 Dorset Road, Merton Park, London, SW19 3HA
Photo: Spudgun67, CC0 · Wikimedia Commons
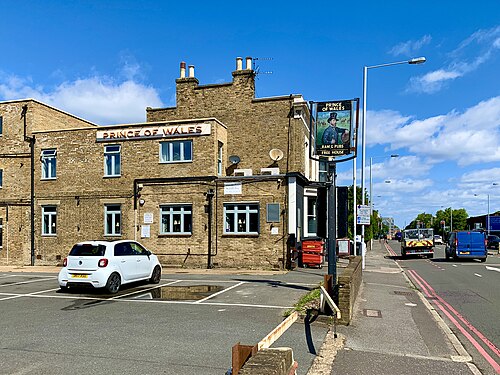
Prince of Wales Morden Road, SW19, Morden Road
Morden Road · Prince of Wales Morden Road, SW19
Photo: TheFrog001, CC0 · Wikimedia Commons
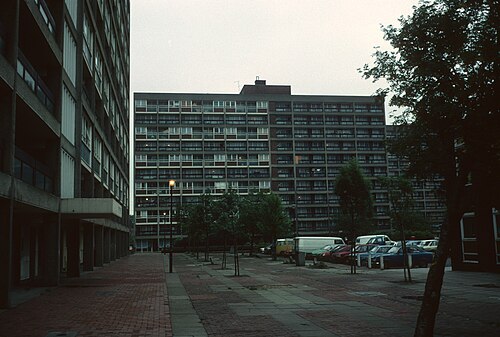
<Div Class='fn'> Tower Blocks UK: Merton London Phipps Bridge Redevelopment, Stages I-IV, L31-14.Jpg</Div>, Phipps Bridge
Phipps Bridge · <Div Class='fn'> Tower Blocks UK: Merton London Phipps Bridge Redevelopment, Stages I-IV, L31-14.Jpg</Div>
Photo: Miles Glendinning, CC BY 4.0 · Wikimedia Commons
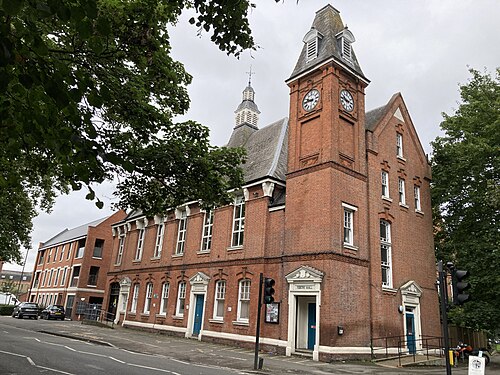
Mitcham Vestry House 2021-09-15, Mitcham
Mitcham · Mitcham Vestry House 2021-09-15
Photo: Matt Brown, CC BY 2.0 · Wikimedia Commons
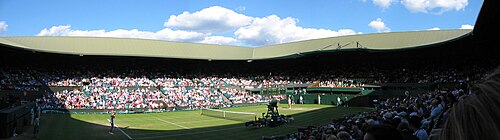
Centre Court Panorama, 2004, Wimbledon Park
Wimbledon Park · Centre Court Panorama, 2004
Photo: Fraser Reid, CC BY 2.0 · Wikimedia Commons
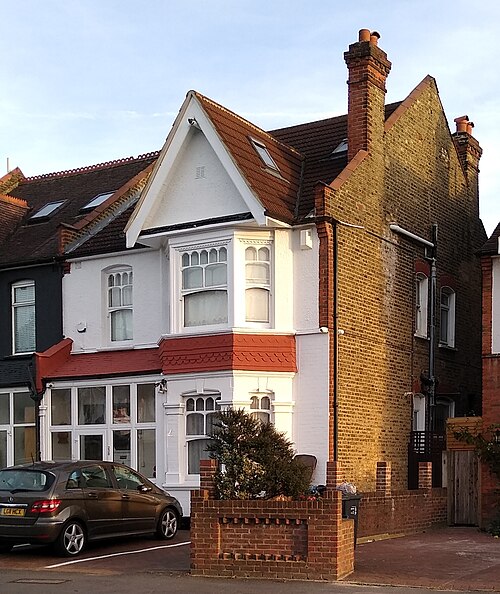
Tuvalu House, London, Raynes Park
Raynes Park · Tuvalu House, London
Photo: Mx. Granger, CC0 · Wikimedia Commons
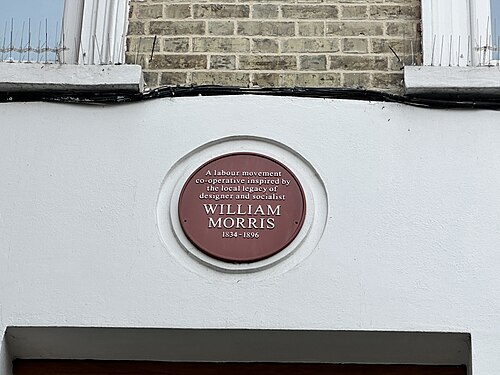
Plaque at William Morris House Wimbledon, South Wimbledon
South Wimbledon · Plaque at William Morris House Wimbledon
Photo: Matt Brown, CC BY 4.0 · Wikimedia Commons
Sanctuary Tower, Tooting
Tooting · Sanctuary Tower
Photo: It's No Game, CC BY 2.0 · Flickr

How neighbourhoods moved each quarter

2023

Whole-area crime rate 16.7 to 19.4 per 1,000 (high: Q3 2023).

Big moves (4+ places in a quarter): moved up Morden Road 13th→8th (Q2) moved up Morden Road 8th→4th (Q3) moved up Belgrave Walk 18th→10th (Q3) moved down Phipps Bridge 6th→11th (Q3) moved down Haydons Road 12th→16th (Q3) moved up Wimbledon Chase 5th→1st (Q4) moved down Raynes Park 6th→10th (Q4)

2024

Whole-area crime rate 17.4 to 20.4 per 1,000 (high: Q3 2024).

Big moves (4+ places in a quarter): moved up Raynes Park 10th→4th (Q1) moved down Wimbledon Chase 1st→6th (Q1) moved up Mitcham Eastfields 14th→10th (Q1) moved down Belgrave Walk 8th→16th (Q1) moved down Beddington Lane 13th→17th (Q1) moved down Raynes Park 4th→8th (Q2) moved up South Wimbledon 13th→9th (Q2) moved up Beddington Lane 17th→10th (Q2) moved down Merton Park 3rd→7th (Q4) moved up Beddington Lane 13th→8th (Q4)

2025

Whole-area crime rate 17.8 to 19.3 per 1,000 (high: Q2 2025).

Big moves (4+ places in a quarter): moved up Mitcham 13th→9th (Q1) moved up Wimbledon Park 18th→11th (Q1) moved down Morden Road 5th→15th (Q1) moved up Morden Road 15th→2nd (Q2) moved down Wimbledon Chase 2nd→6th (Q2) moved down Mitcham 9th→15th (Q2) moved down Beddington Lane 8th→17th (Q2) moved up Wimbledon Chase 6th→2nd (Q3) moved down Merton Park 3rd→8th (Q3) moved up Mitcham 15th→11th (Q3) moved down Phipps Bridge 11th→16th (Q3) moved down Wimbledon Park 12th→18th (Q3) moved up Merton Park 8th→4th (Q4) moved up Haydons Road 13th→9th (Q4) moved up Wimbledon Park 18th→11th (Q4) moved down Mitcham 11th→16th (Q4) moved down Belgrave Walk 14th→18th (Q4)

2026

Whole-area crime rate 16.6 to 17.9 per 1,000 (high: Q2 2026). 2 quarters so far.

Big moves (4+ places in a quarter): moved up Mitcham 16th→11th (Q1) moved up Phipps Bridge 14th→8th (Q2) moved down Raynes Park 7th→11th (Q2) moved up Belgrave Walk 18th→14th (Q2) moved down Haydons Road 8th→15th (Q2)

Reported Safety Incidents

In Q2 2026: violent incidents were 36% (1,432), property incidents were 29% (1,164), public order incidents were 26% (1,054) and vehicle crimes were 8% (337).

Recorded crime here is grouped into violent crime, property crime (burglary and theft), vehicle crime and public order offences, so you can compare how safe each neighbourhood is for the kind of crime that matters to you.

Places we left out, and places to read with care

No place is left out: every neighbourhood in this race has residents to count.

Morden Road (12.8 per 1,000 from 32 crimes among 2,498 residents) is a place with few residents (under 3,000): a rate on so few people says little about living there, so it is not named as the lowest or highest.

The 20 neighbourhoods on the map

Merton is made of 20 neighbourhoods compared here, each in its own colour on the map. They are neighbourhood areas derived by CrimesLog from rail station locations and OS Open Names: 222,902 residents between them.

  • Beddington Lane
  • Belgrave Walk
  • Colliers Wood
  • Dundonald Road
  • Haydons Road
  • Merton Park
  • Mitcham
  • Mitcham Eastfields
  • Morden
  • Morden Road
  • Morden South
  • Motspur Park
  • Phipps Bridge
  • Raynes Park
  • South Merton
  • South Wimbledon
  • Tooting
  • Wimbledon
  • Wimbledon Chase
  • Wimbledon Park

All 20 neighbourhoods, Q2 2026

Crimes per 1,000 residents, Q2 2026, lowest first. The last two columns compare with Q1 2023.
#NeighbourhoodResidentsAllViolentPropertyVehiclePublic orderRate vs Q1 2023Places gained
1Dundonald Road6,4027.52.21.40.83.1down2%–
2Merton Park4,2367.82.11.91.22.6down20%up1
3South Merton9,0758.43.12.01.32.0down9%down1
4Wimbledon Chase9,3199.83.42.90.43.0down24%up1
5Morden Road †2,49812.83.62.82.04.4down26%up8
6Morden South16,71614.25.93.41.53.5up5%up1
7Motspur Park16,64114.45.64.11.73.0up8%down1
8Phipps Bridge7,72114.56.03.40.74.5up2%–
9Mitcham12,90816.46.92.61.05.9up1%up1
10Wimbledon Park6,73916.86.24.32.43.9down10%up7
11Raynes Park17,25517.05.06.11.74.2up35%down7
12South Wimbledon8,59317.15.85.91.14.3down2%up3
13Tooting21,26017.48.03.11.64.7up1%up1
14Belgrave Walk6,32518.87.92.92.55.5up2%up2
15Haydons Road12,89618.85.58.01.63.7up29%down6
16Colliers Wood16,13420.36.16.61.36.3down2%up2
17Mitcham Eastfields26,87820.78.84.31.66.0up23%down6
18Beddington Lane6,66324.39.08.61.65.1up43%down6
19Wimbledon9,49037.99.518.32.37.8down7%up1
20Morden5,15341.911.416.52.711.3up23%down1

† Morden Road is a place with few residents. A rate on a very small number of residents or crimes is not comparable with the others.

Photographs

59 photographs of the 20 neighbourhoods run along the reel; click one to see it full size. Each is credited here and under the large view.

All 59 photographs and their credits
  1. Merton Park · GRAHAM SUTHERLAND Blue Plaque House - 8 Dorset Road, Merton Park, London, SW19 3HA. Photo: Spudgun67, CC0 · Wikimedia Commons
  2. Morden Road · Prince of Wales Morden Road, SW19. Photo: TheFrog001, CC0 · Wikimedia Commons
  3. Phipps Bridge · <Div Class='fn'> Tower Blocks UK: Merton London Phipps Bridge Redevelopment, Stages I-IV, L31-14.Jpg</Div>. Photo: Miles Glendinning, CC BY 4.0 · Wikimedia Commons
  4. Mitcham · Mitcham Vestry House 2021-09-15. Photo: Matt Brown, CC BY 2.0 · Wikimedia Commons
  5. Wimbledon Park · Centre Court Panorama, 2004. Photo: Fraser Reid, CC BY 2.0 · Wikimedia Commons
  6. Raynes Park · Tuvalu House, London. Photo: Mx. Granger, CC0 · Wikimedia Commons
  7. South Wimbledon · Plaque at William Morris House Wimbledon. Photo: Matt Brown, CC BY 4.0 · Wikimedia Commons
  8. Tooting · Sanctuary Tower. Photo: It's No Game, CC BY 2.0 · Flickr
  9. Colliers Wood · Colliers Wood Tube Station at Night. Photo: Matt Brown, CC BY 2.0 · Wikimedia Commons
  10. Mitcham Eastfields · Mitcham Library 2021-09-15. Photo: Matt Brown, CC BY 2.0 · Wikimedia Commons
  11. Wimbledon · Former Wimbledon Fire Station. Photo: Tim Sheerman-Chase, CC BY 2.0 · Wikimedia Commons
  12. Morden · Bridge at Morden Hall. Photo: Peter Trimming from Croydon, England, CC BY 2.0 · Wikimedia Commons
  13. Wandle Park · Drinking Fountain, Wandle Park, Merton High Street - London.. Photo: Jim Linwood, CC BY 2.0 · Flickr
  14. Morden Road · Morden Hall Park. Photo: Peter Trimming from Croydon, England, CC BY 2.0 · Wikimedia Commons
  15. Mitcham · Mitcham Fire Station. Photo: Matt From London, CC BY 2.0 · Flickr
  16. Wimbledon Park · Clock in London 135. Photo: maggie jones., Public domain · Wikimedia Commons
  17. Raynes Park · 11, 12 & 13 Crooked Billet, Wimbledon, London SW19. Photo: Cristian Bortes from Cluj-Napoca, Romania, CC BY 2.0 · Wikimedia Commons
  18. South Wimbledon · 02 South Wimbledon Station Front. Photo: TheFrog001, CC0 · Wikimedia Commons
  19. Tooting · Police Station. Photo: Wildebeast1, CC BY 2.0 · Flickr
  20. Colliers Wood · London, UK. Photo: pudina, CC BY 3.0 · Wikimedia Commons
  21. Mitcham Eastfields · Laings Avenue. Photo: roveringcloud, CC BY 3.0 · Wikimedia Commons
  22. Wimbledon · Former Church, Now Boots, Centre Court Shopping Centre, Wimbledon 1. Photo: Tim Sheerman-Chase, CC BY 2.0 · Wikimedia Commons
  23. Morden · Millennium Bridge. Photo: Nanagyei, CC BY 2.0 · Flickr
  24. Wandle Park · The Ashby Drinking Fountain, Wandle Park, Merton - London.. Photo: Jim Linwood, CC BY 2.0 · Flickr
  25. Mitcham · Mitcham Library. Photo: Matt From London, CC BY 2.0 · Flickr
  26. Raynes Park · Raynes Park Tavern, Raynes Park, London.. Photo: Jim Linwood, CC BY 2.0 · Flickr
  27. South Wimbledon · Pelham High School, Wimbledon 2. Photo: Tim Sheerman-Chase, CC BY 2.0 · Wikimedia Commons
  28. Colliers Wood · Francis Kitz 1849-1923 Plaque - 1 Wandle Bank Colliers Wood London SW19 1DW. Photo: Spudgun67, CC0 · Wikimedia Commons
  29. Mitcham Eastfields · Mitcham Clock 2021-09-15. Photo: Matt Brown, CC BY 2.0 · Wikimedia Commons
  30. Wimbledon · Communications Workers Union Office, Wimbledon. Photo: Tim Sheerman-Chase, CC BY 2.0 · Wikimedia Commons
  31. Morden · Stables, Morden Hall Park, London. Photo: orangeaurochs, CC BY 2.0 · Flickr
  32. Mitcham · Station Court, Mitcham. Photo: Matt From London, CC BY 2.0 · Flickr
  33. South Wimbledon · Polka Theatre 2026-09-13. Photo: Matt Brown, CC BY 4.0 · Wikimedia Commons
  34. Colliers Wood · Christ Church, Colliers Wood - London.. Photo: Jim Linwood, CC BY 2.0 · Flickr
  35. Wimbledon · Evening Standard Pub of the Year 1970 Plaque. Photo: Matt Brown, CC BY 4.0 · Wikimedia Commons
  36. Morden · River Wandle. Photo: garryknight, CC BY 2.0 · Flickr
  37. Mitcham · Bridge Over the River Wandle, Mitcham. Photo: London Less Travelled, CC BY 2.0 · Flickr
  38. South Wimbledon · Nelson Memorial Near South Wimbledon. Photo: Matt Brown, CC BY 2.0 · Wikimedia Commons
  39. Colliers Wood · Colliers Wood Library. Photo: JuliaC2006, CC BY 2.0 · Flickr
  40. Wimbledon · Bethel Strict Baptist Chapel, Wimbledon. Photo: Tim Sheerman-Chase, CC BY 2.0 · Wikimedia Commons
  41. Morden · Morden Hall Park, London. Photo: orangeaurochs, CC BY 2.0 · Flickr
  42. Mitcham · London Road Mitcham. Photo: satguru, CC BY 2.0 · Flickr
  43. South Wimbledon · Drinking Trough and Postbox High Path Estate. Photo: Matt Brown, CC BY 2.0 · Wikimedia Commons
  44. Colliers Wood · The Royal Standard Pub, Colliers Wood - London.. Photo: Jim Linwood, CC BY 2.0 · Flickr
  45. Wimbledon · Electricity Transformer in Wimbledon 01. Photo: Matt Brown, CC BY 2.0 · Wikimedia Commons
  46. Mitcham · Remains of Mitcham Windmill. Photo: Matt From London, CC BY 2.0 · Flickr
  47. Colliers Wood · Colliers Wood Tower - London.. Photo: Jim Linwood, CC BY 2.0 · Flickr
  48. Wimbledon · Clock in London 175. Photo: maggie jones., Public domain · Wikimedia Commons
  49. Mitcham · Thank You NHS and Clock. Photo: Matt From London, CC BY 2.0 · Flickr
  50. Colliers Wood · Wandle Bank Colliers Wood London SW19 1DW. Photo: Spudgun67, CC0 · Wikimedia Commons
  51. Wimbledon · Beautiful Shop Frontage.. Photo: Maggie Jones from London, England, Public domain · Wikimedia Commons
  52. Mitcham · Canons House in Mitcham. Photo: Matt From London, CC BY 2.0 · Flickr
  53. Wimbledon · England 2008-01-19. Photo: Guillaume Baviere from Uppsala, Sweden, CC BY 2.0 · Wikimedia Commons
  54. Mitcham · Plaques on Mitcham Cricket Pavilion. Photo: Matt From London, CC BY 2.0 · Flickr
  55. Wimbledon · England 2008-01-19. Photo: Guillaume Baviere from Uppsala, Sweden, CC BY 2.0 · Wikimedia Commons
  56. Mitcham · Cold Blows, Mitcham. Photo: Matt From London, CC BY 2.0 · Flickr
  57. Mitcham · Mitcham Clock. Photo: Matt From London, CC BY 2.0 · Flickr
  58. Mitcham · Mary Tate's Cottages. Photo: Matt From London, CC BY 2.0 · Flickr
  59. Mitcham · Eagle House, Mitcham. Photo: Matt From London, CC BY 2.0 · Flickr

Sources and notes

CrimesLog sources crime incident data as published by the UK Home Office through their national data portal at data.police.uk and licensed under their Open Government Licence v3.0. Reported crime incidents originate from individual Territorial Police Forces of England, Wales and Northern Ireland

Contains ONS data © Crown copyright and database right. Contains NISRA data © Crown copyright. Licensed under the Open Government Licence v3.0.

First-place medal: 1st Place Medal emoji icon by Icons8.

Neighbourhood areas derived by CrimesLog from rail station locations (NaPTAN, Department for Transport) and OS Open Names. Contains OS data © Crown copyright and database right 2024; contains public sector information licensed under the Open Government Licence v3.0. The photographs are credited under each picture.

Rates are recorded crimes per 1,000 residents, quarter by quarter; where a neighbourhood has fewer than 100 residents the rate would be worked out on 100 (those places are left out of the race). A count of recorded crime is not a verdict on any neighbourhood.