Texas · Neighborhood crime trends

Austin Central East

16 neighborhoods - a quarterly race to the lowest crime rate.

Crime Trends: Neighborhoods compared - each quarter from Q1 2022

Austin as a whole averaged 19.0 crimes for every 1,000 residents per quarter in Q2 2026, while central and east Austin averaged 26.1, hence it is generally less safe when all crimes are considered.

How do the 16 neighborhoods of central and east Austin compare? In Q2 2026 the police recorded 2,164 crimes across them, 26.1 for every 1,000 residents. That is 5.0% above a year earlier and 11.0% above Q1 2022, the first quarter we track.

Harris Branch has the lowest rate of the everyday neighborhoods (8.2 per 1,000), followed by Rogers Hill (11.7) and Pecan Springs-Springdale (15.8). East Cesar Chavez has the highest (70.7).

Use the RACE CHARTS below to watch all 16 AUSTIN CENTRAL EAST NEIGHBORHOODs race across 18 quarter periods from Q1 2022 to Q2 2026 - one crime category at a time or all together. The race chart can be used to compare average crime rates by category against Austin's average.

Neighborhood boundaries are defined by City of Austin Open Data, grouped into eight areas by CrimesLog from Austin Police Department sectors; simplified by CrimesLog.
Lowest rate (everyday)
lowest rateHarris Branch
8.2 crimes per 1,000 residents, Q2 2026
Highest rate
upEast Cesar Chavez
70.7 per 1,000, Q2 2026
Whole area, Q2 2026
26.1 per 1,000
up 5.0% above a year earlier · up 11.0% above Q1 2022
Compared
16 neighborhoods
82,985 residents · 18 quarters

Austin Central East neighborhood quarterly crime race

Press ▶︎ to watch Q1 2022 to Q2 2026. Tick one crime category or several; hover a bar for the neighborhood. Property crimes includes burglaries and thefts.

Crime categories
Indicated: crimes rate per 1000 residents per quarterAll · safest at the top · square-root scale · Q1 2022 to Q2 202601510255027.4Central East Austin13.1Chestnut30.5Decker Lake60.1East Cesar Chavez35.8Govalle7.4Harris Branch36.0Holly28.3Johnston Terrace32.3LBJ33.9MLK25.3MLK-18316.5Pecan Springs-Springdale15.3Rogers Hill22.7Rosewood22.0Upper Boggy Creek0.0Whisper ValleyAustin Q2 2026 average all crimes (19.0)Numbers are crimes per 1,000 residents per quarter. Zero-crime quarters show 0 and rank safest.
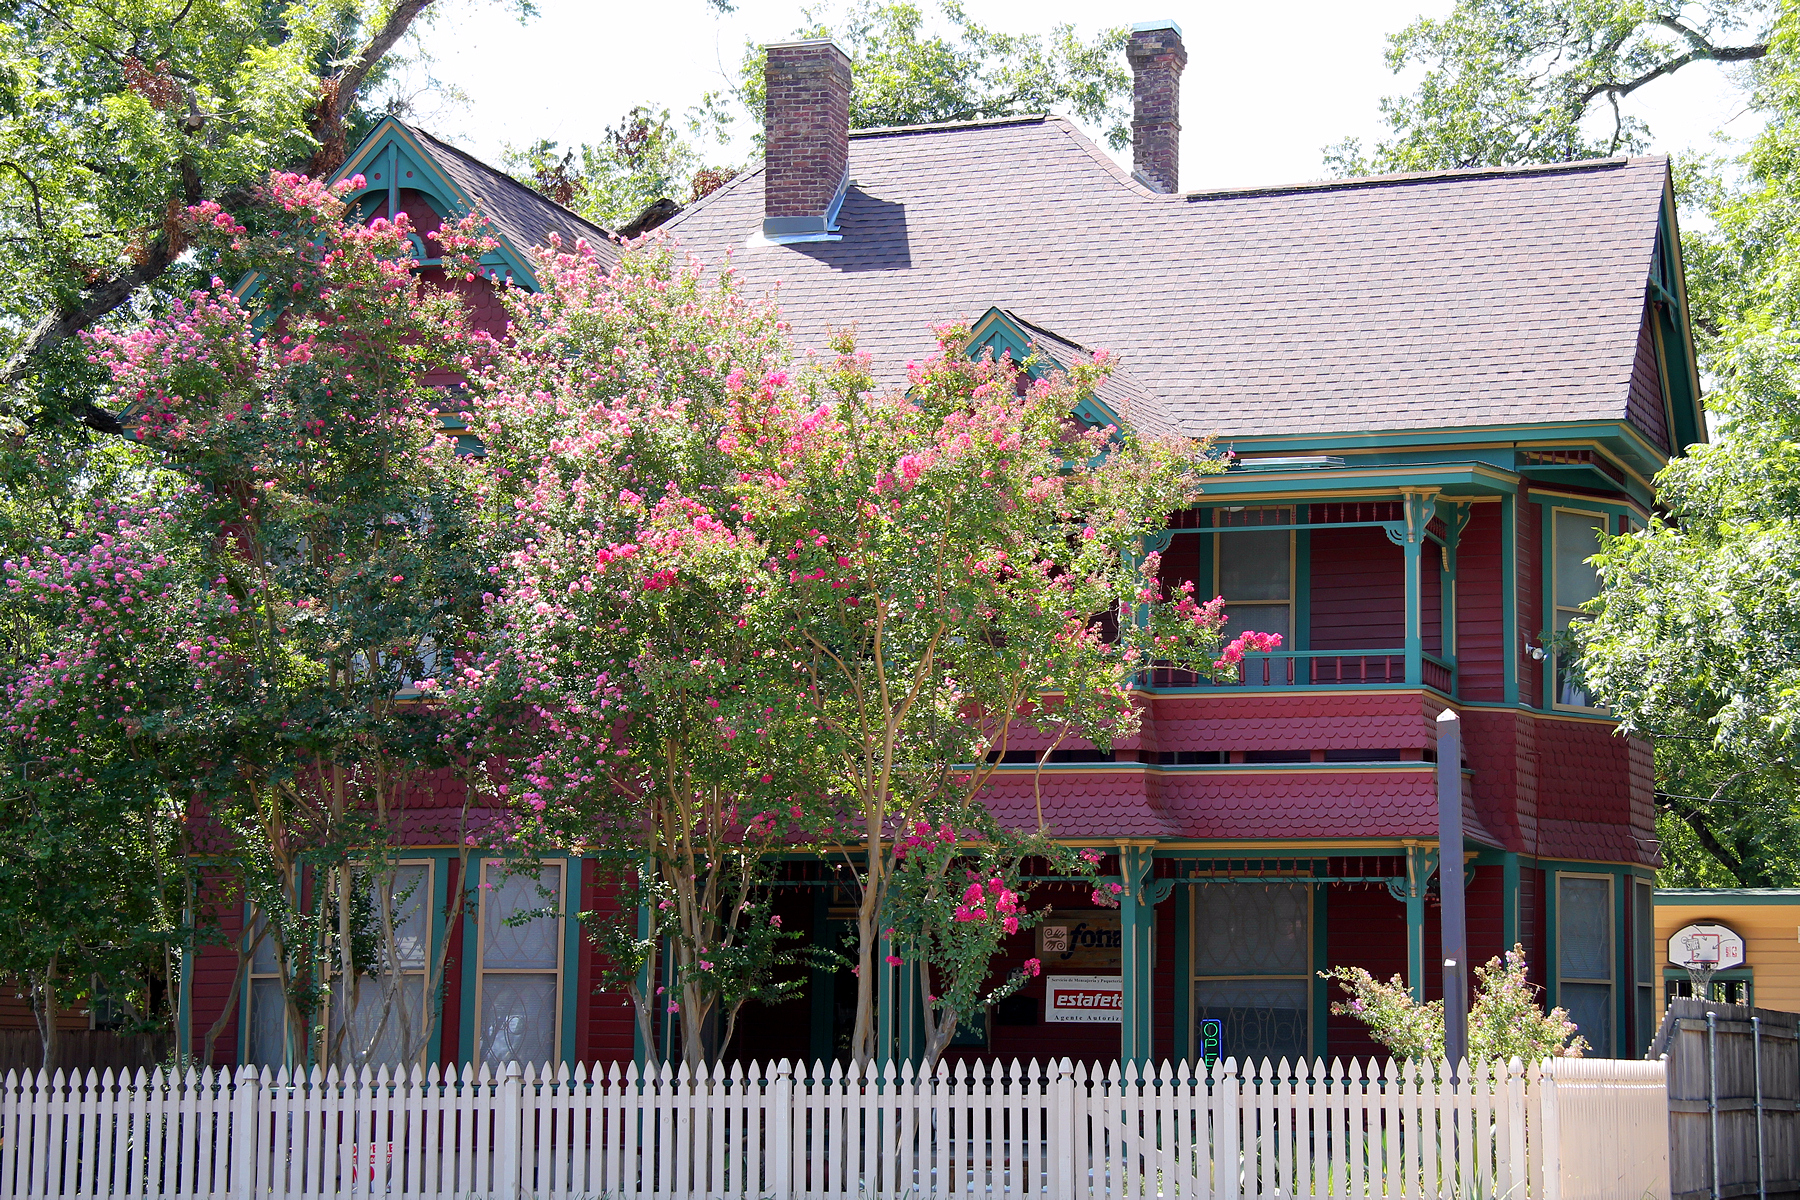
Charles Moreland House 2011, East Cesar Chavez You checked the neighborhood.Now check an address ! Photo: Larry D. Moore, CC BY 4.0 · Wikimedia Commons

For $34.00 a CrimesLog™ Home Report provides: (where available)

  • Nearest 6 Pre-school Nurseries to Address
  • Nearest 6 Primary Schools to Address
  • Nearest 6 Secondary/High Schools to Address
  • Nearest College and University to Address
  • Nearest to Address Medical Clinics, Hospitals and Pharmacies
  • Nearest 2 Police Station details to Address

The Home Report also provides

  • The CrimesLog™ Home Score is a proprietary Home Safety Measure capturing crime frequency, severity, recency and proximity to Address from police crime reporting point
  • A map indicating police anonymized crime reporting points around Address
  • Crime category trendlines for Address neighborhood
  • List of Reported Crime Incidents around Address radius
  • Downloadable PDF report — A Permanent Copy to Keep and Share to aid your Property Research
  • Our crimes database of almost 60 million records is UPDATED EVERY MONTH from US, UK, CA police sources
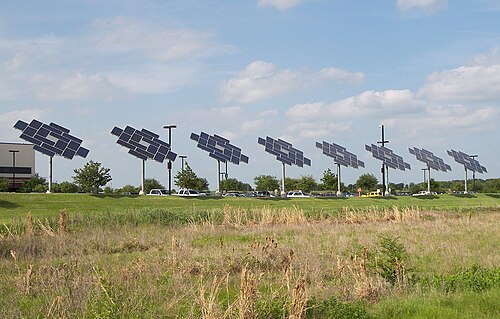
Applied Materials Solar Arrray1, Harris Branch
Harris Branch · Applied Materials Solar Arrray1
Photo: Larry D. Moore, CC BY 4.0 · Wikimedia Commons
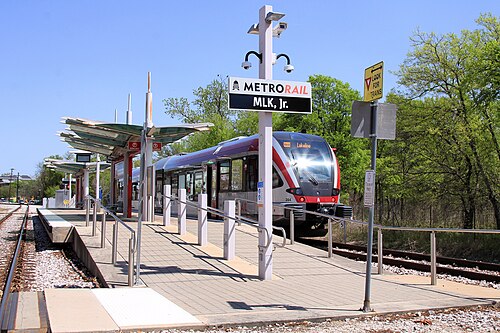
Capital MetroRail MLK Jr Station 2021, Chestnut
Chestnut · Capital MetroRail MLK Jr Station 2021
Photo: Larry D. Moore, CC BY 4.0 · Wikimedia Commons
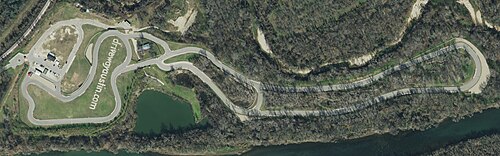
Driveway Austin Orthoimage, Rogers Hill
Rogers Hill · Driveway Austin Orthoimage
Photo: United States Geological Survey, Public domain · Wikimedia Commons
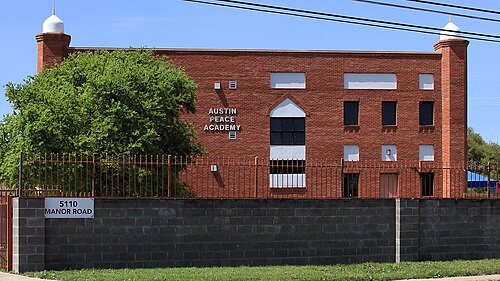
Austin Peace Academy 2021, Pecan Springs-Springdale
Pecan Springs-Springdale · Austin Peace Academy 2021
Photo: Larry D. Moore, CC BY 4.0 · Wikimedia Commons
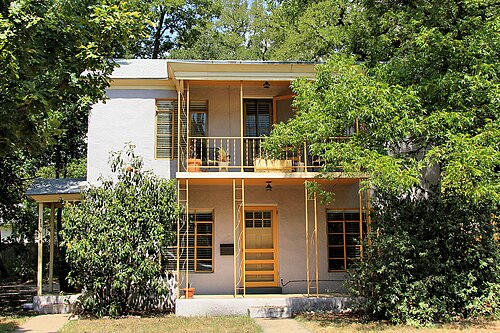
Delwood Duplex 1302, Upper Boggy Creek
Upper Boggy Creek · Delwood Duplex 1302
Photo: Larry D. Moore, CC BY 4.0 · Wikimedia Commons
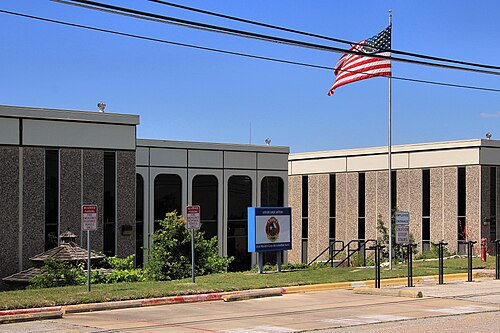
AFD Headquarters, MLK-183
MLK-183 · AFD Headquarters
Photo: Larry D. Moore, CC BY 4.0 · Wikimedia Commons
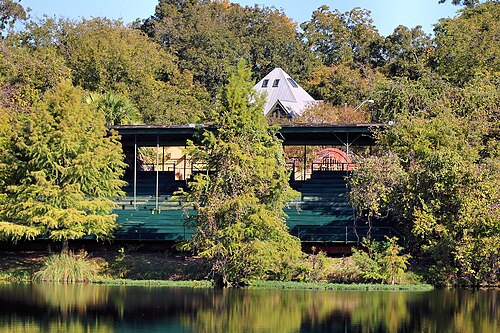
Grandstand Fiesta Gardens Austin Texas 2025, Holly
Holly · Grandstand Fiesta Gardens Austin Texas 2025
Photo: Larry D. Moore, CC BY 4.0 · Wikimedia Commons
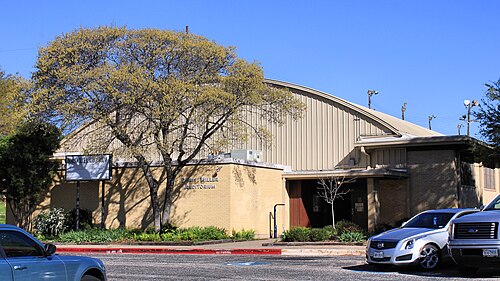
Doris Miller Auditorium Austin Texas, Rosewood
Rosewood · Doris Miller Auditorium Austin Texas
Photo: Larry D. Moore, CC BY 4.0 · Wikimedia Commons

How neighborhoods moved each quarter

2022

Whole-area crime rate 23.5 to 23.9 per 1,000 (high: Q2 2022).

Big moves (4+ places in a quarter): moved up Decker Lake 11th→7th (Q2) moved down Rosewood 7th→11th (Q2) moved up Holly 15th→10th (Q3) moved down Decker Lake 7th→14th (Q3) moved down Johnston Terrace 10th→15th (Q3) moved up Decker Lake 14th→10th (Q4)

2023

Whole-area crime rate 24.5 to 26.5 per 1,000 (high: Q3 2023).

Big moves (4+ places in a quarter): moved up LBJ 14th→9th (Q1) moved down LBJ 9th→13th (Q3)

2024

Whole-area crime rate 24.1 to 25.7 per 1,000 (high: Q2 2024).

Big moves (4+ places in a quarter): moved up Holly 12th→8th (Q1) moved down LBJ 10th→14th (Q1) moved up Johnston Terrace 12th→8th (Q4)

2025

Whole-area crime rate 24.4 to 26.4 per 1,000 (high: Q4 2025).

Big moves (4+ places in a quarter): moved down Johnston Terrace 8th→14th (Q1)

2026

Whole-area crime rate 25.2 to 26.1 per 1,000 (high: Q2 2026). 2 quarters so far.

No neighborhood moved more than three places in a quarter.

Reported Safety Incidents

In Q2 2026: public order incidents were 38% (825), property incidents were 27% (576), violent incidents were 19% (416) and vehicle crimes were 16% (347).

Recorded crime here is grouped into violent crime, property crime (burglary and theft), vehicle crime and public order offences, so you can compare how safe each neighborhood is for the kind of crime that matters to you.

Places we left out, and places to read with care

No place is left out: every neighborhood in this race has residents to count.

Whisper Valley (0.0 per 1,000 from 0 crimes among 411 residents), Decker Lake (95.9 per 1,000 from 44 crimes among 459 residents), Johnston Terrace (54.0 per 1,000 from 103 crimes among 1,906 residents) and Chestnut (10.6 per 1,000 from 29 crimes among 2,744 residents) are places with few residents (under 3,000): a rate on so few people says little about living there, so they are not named as the lowest or highest.

The 16 neighborhoods on the map

Austin Central East is made of 16 neighborhoods compared here, each in its own colour on the map. They are the City of Austin’s neighborhood areas, grouped into eight areas by CrimesLog from Austin Police Department sectors: 82,985 residents between them.

  • Central East Austin
  • Chestnut
  • Decker Lake
  • East Cesar Chavez
  • Govalle
  • Harris Branch
  • Holly
  • Johnston Terrace
  • LBJ
  • MLK
  • MLK-183
  • Pecan Springs-Springdale
  • Rogers Hill
  • Rosewood
  • Upper Boggy Creek
  • Whisper Valley

All 16 neighborhoods, Q2 2026

Crimes per 1,000 residents, Q2 2026, lowest first. The last two columns compare with Q1 2022.
#NeighborhoodResidentsAllViolentPropertyVehiclePublic orderRate vs Q1 2022Places gained
1Whisper Valley †4110.00.00.00.00.0upNaN%–
2Harris Branch10,1088.21.81.61.13.8up11%–
3Chestnut †2,74410.61.82.23.33.3down19%–
4Rogers Hill13,62511.72.81.51.85.7down24%–
5Pecan Springs-Springdale8,02015.82.73.21.48.5down4%–
6Upper Boggy Creek6,27718.23.05.63.26.4down17%–
7MLK-1837,47021.44.55.92.58.4down15%up1
8LBJ3,89730.57.26.93.912.6down6%up4
9Holly4,30032.63.314.77.96.7down10%up6
10Rosewood4,48633.27.88.52.914.0up46%down3
11Central East Austin6,02433.44.07.610.311.4up22%down2
12MLK4,56947.38.512.54.421.9up39%up1
13Govalle4,99551.98.613.212.617.4up45%up1
14Johnston Terrace †1,90654.013.114.72.124.1up91%down4
15East Cesar Chavez3,69470.716.825.79.518.7up18%up1
16Decker Lake †45995.921.819.615.339.2up214%down5

† Whisper Valley, Decker Lake, Johnston Terrace and Chestnut are places with few residents. A rate on a very small number of residents or crimes is not comparable with the others.

Photographs

49 photographs of the 16 neighborhoods run along the reel; click one to see it full size. Each is credited here and under the large view.

All 49 photographs and their credits
  1. Harris Branch · Applied Materials Solar Arrray1. Photo: Larry D. Moore, CC BY 4.0 · Wikimedia Commons
  2. Chestnut · Capital MetroRail MLK Jr Station 2021. Photo: Larry D. Moore, CC BY 4.0 · Wikimedia Commons
  3. Rogers Hill · Driveway Austin Orthoimage. Photo: United States Geological Survey, Public domain · Wikimedia Commons
  4. Pecan Springs-Springdale · Austin Peace Academy 2021. Photo: Larry D. Moore, CC BY 4.0 · Wikimedia Commons
  5. Upper Boggy Creek · Delwood Duplex 1302. Photo: Larry D. Moore, CC BY 4.0 · Wikimedia Commons
  6. MLK-183 · AFD Headquarters. Photo: Larry D. Moore, CC BY 4.0 · Wikimedia Commons
  7. Holly · Grandstand Fiesta Gardens Austin Texas 2025. Photo: Larry D. Moore, CC BY 4.0 · Wikimedia Commons
  8. Rosewood · Doris Miller Auditorium Austin Texas. Photo: Larry D. Moore, CC BY 4.0 · Wikimedia Commons
  9. Central East Austin · Bailetti House 2011. Photo: Larry D. Moore, CC BY 4.0 · Wikimedia Commons
  10. MLK · Givens Park Amphitheater Austin Texas. Photo: Larry D. Moore, CC BY 4.0 · Wikimedia Commons
  11. Govalle · Montopolis Bridge 2013. Photo: Larry D. Moore, CC BY 4.0 · Wikimedia Commons
  12. Johnston Terrace · US 183 South Project Construction and Delays Austin. Photo: Larry D. Moore, CC BY 4.0 · Wikimedia Commons
  13. East Cesar Chavez · Charles Moreland House 2011. Photo: Larry D. Moore, CC BY 4.0 · Wikimedia Commons
  14. Harris Branch · Harris Branch, Just Downstream of Harris Branch Parkway. Photo: Pounce, CC0 · Wikimedia Commons
  15. Chestnut · Capital MetroRail MLK Jr Station Night 2021. Photo: Larry D. Moore, CC BY 4.0 · Wikimedia Commons
  16. Upper Boggy Creek · Della Phillips House Austin Texas 2025. Photo: Larry D. Moore, CC BY 4.0 · Wikimedia Commons
  17. Holly · El Mundo Austin Headquarters 2017. Photo: Larry D. Moore, CC BY 4.0 · Wikimedia Commons
  18. Rosewood · Anderson Stadium Austin Texas 2022. Photo: Larry D. Moore, CC BY 4.0 · Wikimedia Commons
  19. Central East Austin · Arnold Bakery. Photo: Happywaffle at en.wikipedia, Public domain · Wikimedia Commons
  20. Govalle · Bathhouse Parque Zaragosa Austin, Texas 2023. Photo: Larry D. Moore, CC BY 4.0 · Wikimedia Commons
  21. Johnston Terrace · The Original Townsite of Montopolis, Historical Marker. Photo: Rdenney, CC0 · Wikimedia Commons
  22. East Cesar Chavez · Chalmers Court 2014. Photo: Larry D. Moore, CC BY 4.0 · Wikimedia Commons
  23. Harris Branch · Harris Branch, Midway Between Harris Branch Parkway and Boyce Lane. Photo: Pounce, CC0 · Wikimedia Commons
  24. Chestnut · Nixta Taqueria Austin Texas 2025. Photo: Larry D. Moore, CC BY 4.0 · Wikimedia Commons
  25. Upper Boggy Creek · David Chapel Baptist Church Austin Texas 2025. Photo: Larry D. Moore, CC BY 4.0 · Wikimedia Commons
  26. Holly · East Austin Gentrification Willow St 2018. Photo: Larry D. Moore, CC BY 4.0 · Wikimedia Commons
  27. Rosewood · Anderson Stadium Fieldhouse Austin Texas 2022. Photo: Larry D. Moore, CC BY 4.0 · Wikimedia Commons
  28. Central East Austin · Austin September 11 Memorial. Photo: Larry D. Moore, CC BY 4.0 · Wikimedia Commons
  29. Govalle · Footbridge Parque Zaragoza Austin Texas 2023. Photo: Larry D. Moore, CC BY 4.0 · Wikimedia Commons
  30. East Cesar Chavez · Comal Street Austin 400-300 Block South View. Photo: Larry D. Moore, CC BY 4.0 · Wikimedia Commons
  31. Chestnut · Comadre Panaderia Austin Texas 2025. Photo: Larry D. Moore, CC BY 4.0 · Wikimedia Commons
  32. Holly · Joes Bakery Austin Texas 2025. Photo: Larry D. Moore, CC BY 4.0 · Wikimedia Commons
  33. Rosewood · Eastside Early College High School Austin Texas 2023. Photo: Larry D. Moore, CC BY 4.0 · Wikimedia Commons
  34. Central East Austin · African American Cultural Heritage Facility Austin Texas 2023. Photo: Larry D. Moore, CC BY 4.0 · Wikimedia Commons
  35. Govalle · Baseball Field Parque Zaragoza Austin Texas 2023. Photo: Larry D. Moore, CC BY 4.0 · Wikimedia Commons
  36. East Cesar Chavez · Cap Metro Train. Photo: Steven Polunsky, CC BY 2.0 · Wikimedia Commons
  37. Holly · Cantu Pan American Center Austin Texas 2026. Photo: Larry D. Moore, CC BY 4.0 · Wikimedia Commons
  38. Rosewood · Entrance Downs Field Austin Texas. Photo: Larry D. Moore, CC BY 4.0 · Wikimedia Commons
  39. Central East Austin · Briones House Austin 2009. Photo: Larry D. Moore, CC BY 4.0 · Wikimedia Commons
  40. East Cesar Chavez · Central Health Austin Texas 2021. Photo: Larry D. Moore, CC BY 4.0 · Wikimedia Commons
  41. Holly · East Austin Gentrification Holly St 2018. Photo: Larry D. Moore, CC BY 4.0 · Wikimedia Commons
  42. Central East Austin · Artwork by Paola Vazquez. Photo: NPS Photo, Public domain · Wikimedia Commons
  43. East Cesar Chavez · Austin Skyline from the Southeast 2022. Photo: Larry D. Moore, CC BY 4.0 · Wikimedia Commons
  44. Holly · Concession Building Fiesta Gardens Austin Texas 2025. Photo: Larry D. Moore, CC BY 4.0 · Wikimedia Commons
  45. East Cesar Chavez · Clements Market The Sport Bar Austin Texas 2023. Photo: Larry D. Moore, CC BY 4.0 · Wikimedia Commons
  46. East Cesar Chavez · Huston Tillotson University 2015. Photo: Larry D. Moore, CC BY 4.0 · Wikimedia Commons
  47. East Cesar Chavez · Hope Farmers Market Sign Plaza Saltillo. Photo: Larry D. Moore, CC BY 4.0 · Wikimedia Commons
  48. East Cesar Chavez · Historic Scoot Inn Austin 2019. Photo: Larry D. Moore, CC BY 4.0 · Wikimedia Commons
  49. East Cesar Chavez · Johnson and Johnson Grocery Austin Texas 2026. Photo: Larry D. Moore, CC BY 4.0 · Wikimedia Commons

Sources and notes

CrimesLog sources crime incident data published by the Austin Police Department (APD) through the City of Austin ArcGIS Open Data service (maps.austintexas.gov), containing public sector information made available by the City of Austin.

Population: U.S. Census Bureau, American Community Survey 5-year estimates (public domain).

First-place medal: 1st Place Medal emoji icon by Icons8.

Neighborhood boundaries are defined by City of Austin Open Data, grouped into eight areas by CrimesLog from Austin Police Department sectors and simplified by CrimesLog. The photographs are credited under each picture.

Rates are recorded crimes per 1,000 residents, quarter by quarter; where a neighborhood has fewer than 100 residents the rate would be worked out on 100 (those places are left out of the race). A count of recorded crime is not a verdict on any neighborhood.