London · Neighbourhood crime trends

London Hillingdon

24 neighbourhoods - a quarterly race to the lowest crime rate.

Crime Trends: Neighbourhoods compared - each quarter from Q1 2023

London as a whole averaged 28.0 crimes for every 1,000 residents per quarter in Q2 2026, while Hillingdon averaged 24.3 (leaving out 5 places with almost no residents), hence it is generally safer when all crimes are considered.

How do the 24 neighbourhoods of Hillingdon compare? In Q2 2026 the police recorded 7,644 crimes across them, 24.3 for every 1,000 residents. That is 3.4% below a year earlier and 23.3% above Q1 2023, the first quarter we track.

Ruislip Gardens has the lowest rate of the everyday neighbourhoods (8.0 per 1,000), followed by West Ruislip (11.1) and Ickenham (11.9). Sipson has the highest (123.6).

Use the RACE CHARTS below to watch all 24 LONDON HILLINGDON NEIGHBOURHOODs race across 14 quarter periods from Q1 2023 to Q2 2026 - one crime category at a time or all together. The race chart can be used to compare average crime rates by category against London's average.

Neighbourhood areas derived by CrimesLog from rail station locations (NaPTAN, Department for Transport) and OS Open Names. Contains OS data © Crown copyright and database right 2024; contains public sector information licensed under the Open Government Licence v3.0.
Lowest rate (everyday)
lowest rateRuislip Gardens
8.0 crimes per 1,000 residents, Q2 2026
Highest rate
upSipson
123.6 per 1,000, Q2 2026
Whole area, Q2 2026
24.3 per 1,000
down 3.4% below a year earlier · up 23.3% above Q1 2023
Compared
24 neighbourhoods
315,049 residents · 14 quarters

London Hillingdon neighbourhood quarterly crime race

Press ▶︎ to watch Q1 2023 to Q2 2026. Tick one crime category or several; hover a bar for the neighbourhood. Property crimes includes burglaries and thefts.

Crime categories
Indicated: crimes rate per 1000 residents per quarterAll · safest at the top · square-root scale · Q1 2023 to Q2 202601510255024.3Cranford13.9Denham13.1Eastcote11.1Harefield21.6Harlington30.6Harmondsworth25.6Hayes16.4Hayes End6.2Hill End11.9Hillingdon45.5Hillingdon Heath11.3Ickenham68.0Longford13.3Northwood15.1Northwood Hills14.1Ruislip9.1Ruislip Gardens11.6Ruislip Manor89.4Sipson18.1South Ruislip33.9Uxbridge19.2West Drayton13.2West Ruislip12.9YeadingLondon Q2 2026 average all crimes (28.0)Numbers are crimes per 1,000 residents per quarter. Zero-crime quarters show 0 and rank safest. Not included, no residents: East Bedfont; Iver; Rickmansworth; Stanwell Moor; West Bedfont.
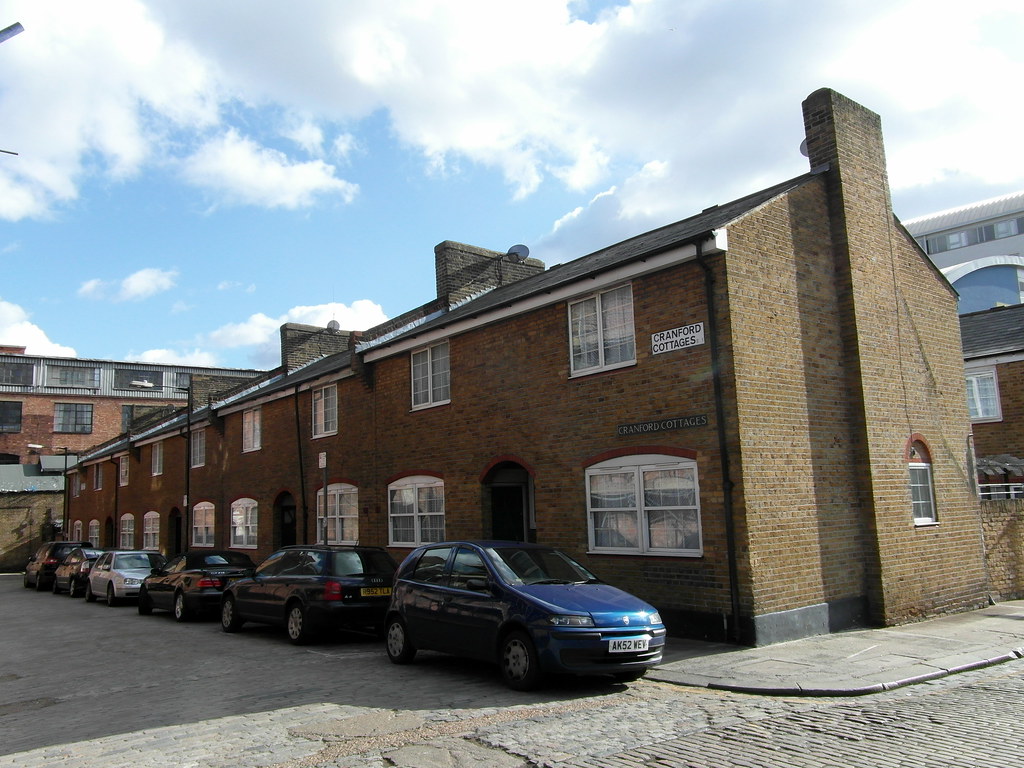
Cranford Cottages, Cranford You checked the neighbourhood.Now check an address ! Photo: Reading Tom, CC BY 2.0 · Flickr

For £24.99 a CrimesLog™ Home Report provides: (where available)

  • Nearest 6 Pre-school Nurseries to Address
  • Nearest 6 Primary Schools to Address
  • Nearest 6 Secondary/High Schools to Address
  • Nearest College and University to Address
  • Nearest to Address GP Practice/Health Centres, Hospitals and Pharmacies
  • Nearest 2 Police Station details to Address

The Home Report also provides

  • The CrimesLog™ Home Score is a proprietary Home Safety Measure capturing crime frequency, severity, recency and proximity to Address from police crime reporting point
  • A map indicating police anonymised crime reporting points around Address
  • Crime category trendlines for Address neighbourhood
  • List of Reported Crime Incidents around Address radius
  • Downloadable PDF report — A Permanent Copy to Keep and Share to aid your Property Research
  • Our crimes database of almost 60 million records is UPDATED EVERY MONTH from US, UK, CA police sources
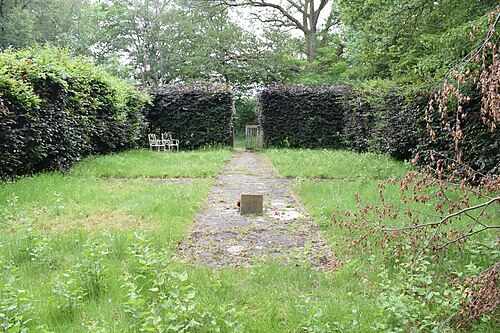
Scouts Open Air Chapel in Mad Bess Woods, Ruislip, West Ruislip
West Ruislip · Scouts Open Air Chapel in Mad Bess Woods, Ruislip
Photo: Victoria Mathilda Morgan, CC0 · Wikimedia Commons
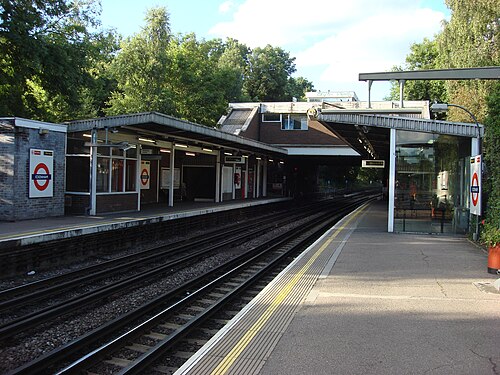
Ickenham Tube Station 3, Ickenham
Ickenham · Ickenham Tube Station 3
Photo: Oxyman, CC BY 2.5 · Wikimedia Commons
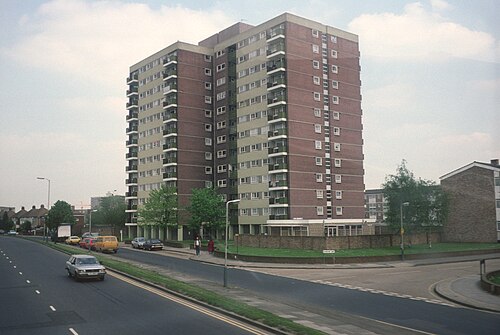
<Div Class='fn'> Tower Blocks UK: Hillingdon London Yeading Green Section 1, Stage B, L35-17.Jpg</Div>, Yeading
Yeading · <Div Class='fn'> Tower Blocks UK: Hillingdon London Yeading Green Section 1, Stage B, L35-17.Jpg</Div>
Photo: Miles Glendinning, CC BY 4.0 · Wikimedia Commons
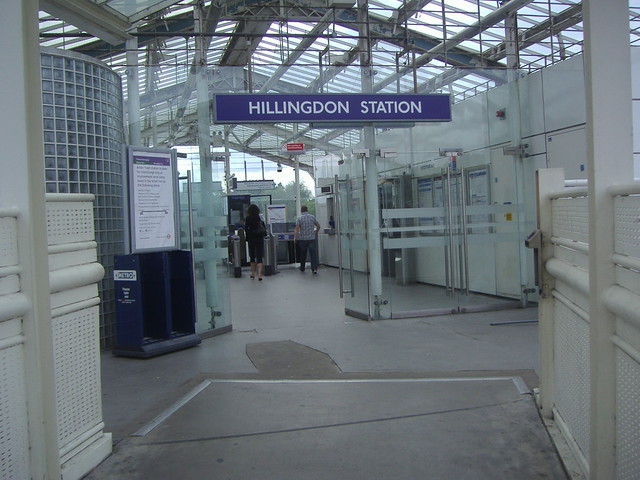
Hillingdon Entrance2, Hillingdon
Hillingdon · Hillingdon Entrance2
Photo: satguru, CC BY 2.0 · Flickr
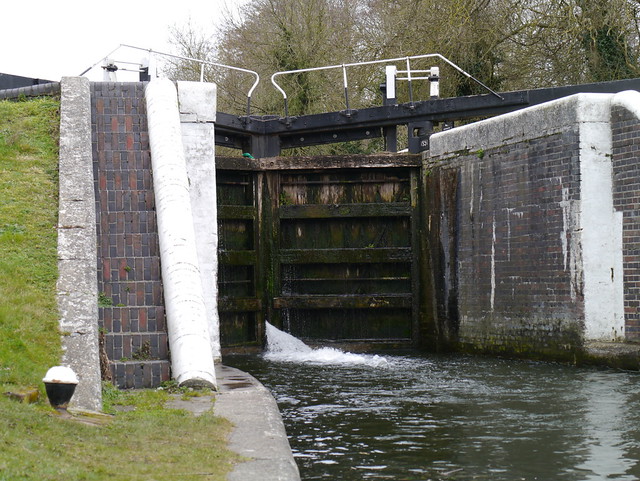
Tall Lock, Denham
Denham · Tall Lock
Photo: shirokazan, CC BY 2.0 · Flickr
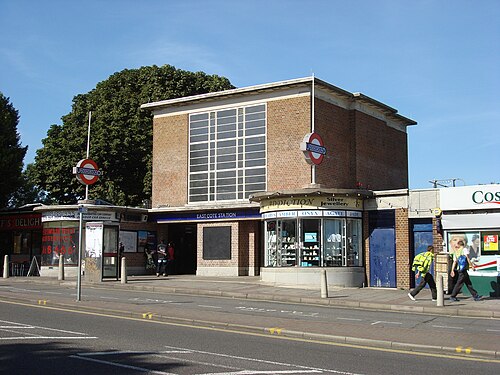
Eastcote Tube Station 2, Eastcote
Eastcote · Eastcote Tube Station 2
Photo: Oxyman, CC BY 2.5 · Wikimedia Commons
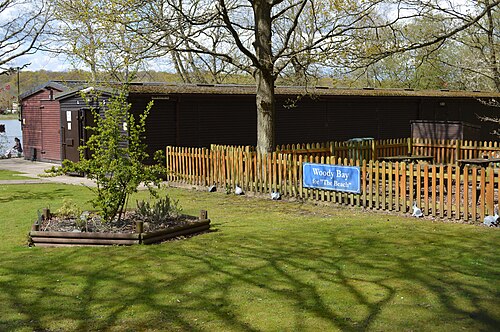
Woody Bay Station, Northwood Hills
Northwood Hills · Woody Bay Station
Photo: Matt Brown, CC BY 2.0 · Wikimedia Commons
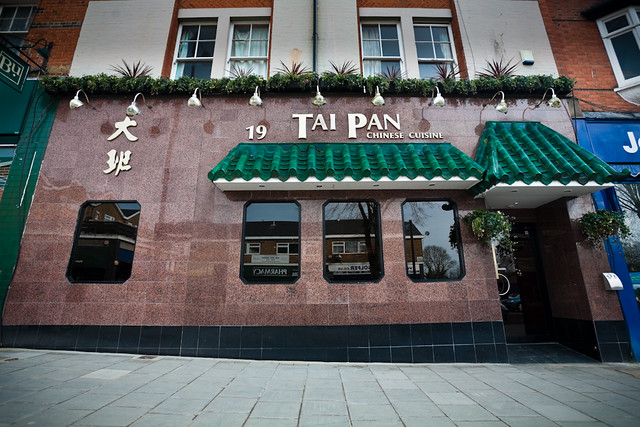
Tai Pan, Northwood
Northwood · Tai Pan
Photo: < J >, CC BY 2.0 · Flickr

How neighbourhoods moved each quarter

2023

Whole-area crime rate 19.7 to 22.9 per 1,000 (high: Q3 2023).

Big moves (4+ places in a quarter): moved up West Ruislip 9th→4th (Q2) moved down Harefield 3rd→10th (Q2) moved down Denham 11th→15th (Q2) moved down Harefield 10th→14th (Q3) moved down Cranford 16th→21st (Q3) moved up Yeading 12th→3rd (Q4) moved up Denham 16th→7th (Q4) moved down Northwood Hills 9th→14th (Q4)

2024

Whole-area crime rate 22.4 to 25.0 per 1,000 (high: Q3 2024).

Big moves (4+ places in a quarter): moved up Ruislip Manor 9th→5th (Q1) moved down Hillingdon 6th→10th (Q1) moved up West Ruislip 8th→4th (Q2) moved up Harefield 14th→6th (Q2) moved down Eastcote 3rd→7th (Q2) moved down Ruislip Manor 5th→11th (Q2) moved up Ruislip Manor 11th→3rd (Q3) moved up Denham 9th→5th (Q3) moved down Ickenham 2nd→6th (Q3) moved down Harefield 6th→11th (Q3) moved down Northwood 8th→15th (Q3) moved up Ruislip 14th→9th (Q4) moved down Ruislip Manor 3rd→10th (Q4) moved up Hillingdon Heath 22nd→16th (Q4)

2025

Whole-area crime rate 23.1 to 26.2 per 1,000 (high: Q3 2025).

Big moves (4+ places in a quarter): moved up Ruislip Manor 11th→7th (Q2) moved down Denham 7th→13th (Q2) moved down Harefield 14th→18th (Q2) moved down Hillingdon Heath 15th→20th (Q2) moved up Hillingdon Heath 20th→8th (Q3) moved up Denham 13th→9th (Q3) moved up Harefield 18th→11th (Q3) moved down Northwood 9th→14th (Q3) moved up Hillingdon 10th→6th (Q4) moved up Ruislip 13th→7th (Q4) moved up Northwood 14th→9th (Q4) moved down Yeading 6th→11th (Q4) moved down Hillingdon Heath 8th→12th (Q4) moved down Denham 9th→15th (Q4) moved down Harefield 11th→17th (Q4)

2026

Whole-area crime rate 23.7 to 24.3 per 1,000 (high: Q2 2026). 2 quarters so far.

Big moves (4+ places in a quarter): moved up Yeading 11th→6th (Q1) moved up Denham 15th→9th (Q1) moved up Harefield 17th→11th (Q1) moved down Ruislip 7th→13th (Q1) moved down Hillingdon Heath 12th→17th (Q1) moved down Harlington 14th→18th (Q1) moved up Harefield 11th→7th (Q2) moved down Eastcote 5th→10th (Q2)

Reported Safety Incidents

In Q2 2026: violent incidents were 34% (2,609), public order incidents were 29% (2,184), property incidents were 28% (2,110) and vehicle crimes were 10% (741).

Recorded crime here is grouped into violent crime, property crime (burglary and theft), vehicle crime and public order offences, so you can compare how safe each neighbourhood is for the kind of crime that matters to you.

Read category comparisons with care. A category that jumps while the total hardly moves looks like a change in how offences are classified, not in what happened: Q2 2025: public order up 26% while the total moved 9%. The whole-area rate is the steadier guide.

Places we left out, and places to read with care

Left out: East Bedfont; Iver; Rickmansworth; Stanwell Moor; West Bedfont. They have almost no residents: their crimes are against visitors, so a rate per resident says little about living there.

Hillingdon Heath (36.4 per 1,000 from 12 crimes among 330 residents), Longford (100.8 per 1,000 from 86 crimes among 853 residents), Harmondsworth (52.7 per 1,000 from 86 crimes among 1,633 residents), Hill End (5.1 per 1,000 from 9 crimes among 1,779 residents), Harefield (14.3 per 1,000 from 36 crimes among 2,516 residents) and Cranford (40.9 per 1,000 from 111 crimes among 2,717 residents) are places with few residents (under 3,000): a rate on so few people says little about living there, so they are not named as the lowest or highest.

The 24 neighbourhoods on the map

Hillingdon is made of 24 neighbourhoods compared here, each in its own colour on the map. They are neighbourhood areas derived by CrimesLog from rail station locations and OS Open Names: 315,049 residents between them.

  • Cranford
  • Denham
  • Eastcote
  • Harefield
  • Harlington
  • Harmondsworth
  • Hayes
  • Hayes End
  • Hill End
  • Hillingdon
  • Hillingdon Heath
  • Ickenham
  • Longford
  • Northwood
  • Northwood Hills
  • Ruislip
  • Ruislip Gardens
  • Ruislip Manor
  • Sipson
  • South Ruislip
  • Uxbridge
  • West Drayton
  • West Ruislip
  • Yeading

All 24 neighbourhoods, Q2 2026

Crimes per 1,000 residents, Q2 2026, lowest first. The last two columns compare with Q1 2023.
#NeighbourhoodResidentsAllViolentPropertyVehiclePublic orderRate vs Q1 2023Places gained
1Hill End †1,7795.12.81.10.60.6down18%–
2Ruislip Gardens7,6018.02.90.52.12.5down12%–
3West Ruislip10,42111.14.51.71.33.6down15%up6
4Ickenham6,46011.94.02.62.32.9up5%–
5Ruislip Manor9,00013.13.63.01.65.0up13%–
6Yeading6,10813.96.72.02.33.0up8%up1
7Harefield †2,51614.35.24.01.24.0up29%down4
8Hillingdon28,45914.86.02.41.64.7up24%down2
9Denham3,31415.45.11.81.86.6up11%up2
10Eastcote16,86315.94.24.62.44.6up21%down2
11Northwood Hills17,11016.44.85.01.15.5up8%up2
12Northwood8,37816.74.17.81.93.0up26%down2
13Hayes End16,59719.38.33.11.56.5up17%up1
14Ruislip8,75620.14.28.71.35.9up43%down2
15Harlington14,59821.98.64.72.46.2up2%up2
16South Ruislip21,21623.57.76.53.65.7up30%down1
17West Drayton56,53226.010.15.92.67.3up36%down1
18Hayes40,15035.111.113.83.07.3up37%up1
19Uxbridge30,26835.512.210.22.210.8up5%up2
20Hillingdon Heath †33036.412.13.09.112.1down20%up2
21Cranford †2,71740.917.79.22.611.4up68%down3
22Harmondsworth †1,63352.716.59.82.523.9up72%down2
23Longford †853100.857.411.77.024.6up48%–
24Sipson3,390123.620.440.110.053.1up38%–

† Hillingdon Heath, Longford, Harmondsworth, Hill End, Harefield and Cranford are places with few residents. A rate on a very small number of residents or crimes is not comparable with the others.

Photographs

44 photographs of the 24 neighbourhoods run along the reel; click one to see it full size. Each is credited here and under the large view.

All 44 photographs and their credits
  1. West Ruislip · Scouts Open Air Chapel in Mad Bess Woods, Ruislip. Photo: Victoria Mathilda Morgan, CC0 · Wikimedia Commons
  2. Ickenham · Ickenham Tube Station 3. Photo: Oxyman, CC BY 2.5 · Wikimedia Commons
  3. Yeading · <Div Class='fn'> Tower Blocks UK: Hillingdon London Yeading Green Section 1, Stage B, L35-17.Jpg</Div>. Photo: Miles Glendinning, CC BY 4.0 · Wikimedia Commons
  4. Hillingdon · Hillingdon Entrance2. Photo: satguru, CC BY 2.0 · Flickr
  5. Denham · Tall Lock. Photo: shirokazan, CC BY 2.0 · Flickr
  6. Eastcote · Eastcote Tube Station 2. Photo: Oxyman, CC BY 2.5 · Wikimedia Commons
  7. Northwood Hills · Woody Bay Station. Photo: Matt Brown, CC BY 2.0 · Wikimedia Commons
  8. Northwood · Tai Pan. Photo: < J >, CC BY 2.0 · Flickr
  9. Ruislip · Ruislip Station - 2026-02-19. Photo: Brett Jordan, CC BY 4.0 · Wikimedia Commons
  10. Harlington · Ariel Hotel (London Heathrow). Photo: Quintin Soloviev, CC BY 4.0 · Wikimedia Commons
  11. West Drayton · St Martin's Church, West Drayton - London.. Photo: Jim Linwood, CC BY 2.0 · Flickr
  12. Hayes · Hayes Vantage Building. Photo: Bohao Zhao, CC BY 3.0 · Wikimedia Commons
  13. Uxbridge · Harman House. Photo: Matt Brown, CC BY 2.0 · Wikimedia Commons
  14. Cranford · In Memory of Tony Hancock and His Mother. Photo: Maxwell Hamilton, CC BY 2.0 · Flickr
  15. Harmondsworth · Heathrow Airport 011. Photo: Panhard, CC BY 2.5 · Wikimedia Commons
  16. Longford · The White Horse Old English Pub at Longford, Near Heathrow, London. Photo: Ben Sutherland, CC BY 2.0 · Flickr
  17. Sipson · The Crown Pub, Sipson, London.. Photo: Jim Linwood, CC BY 2.0 · Flickr
  18. Hillingdon · Windsor Street in Uxbridge. Photo: Matt From London, CC BY 2.0 · Flickr
  19. Northwood · Vintage Postcard Northwood Maxwell Road Shops Middlesex 1909 Pr.. Photo: mark's vintage topographical postcards, Public domain · Flickr
  20. Ruislip · 1935 Postcard of Ruislip High Street to Dadson, 153 Avenue Van Rijswijck Antwerp. Photo: mark's vintage topographical postcards, Public domain · Flickr
  21. Harlington · Sheraton Skyline Hotel London Heathrow, Bath Road, Harlington (December 2014). Photo: User:Hassocks5489, CC0 · Wikimedia Commons
  22. Hayes · House Boats. Photo: Peter Richmond, CC BY 2.0 · Flickr
  23. Uxbridge · Church of St Margaret, Interior, Interior, 2025. Photo: Lollipoplollipoplollipop, CC0 · Wikimedia Commons
  24. Cranford · St Dunstan's Church in Cranford Park. Photo: Maxwell Hamilton, CC BY 2.0 · Flickr
  25. Harmondsworth · Holiday Inn, Heathrow 2012-10-10. Photo: grassrootsgroundswell, CC BY 2.0 · Wikimedia Commons
  26. Harlington · London Heathrow Marriott Hotel, Bath Road, Harlington (December 2014). Photo: User:Hassocks5489, CC0 · Wikimedia Commons
  27. Hayes · House Boats. Photo: Peter Richmond, CC BY 2.0 · Flickr
  28. Uxbridge · Brunel STEM Centre. Photo: Matt Brown, CC BY 2.0 · Wikimedia Commons
  29. Cranford · Altar in St Dunstan's Church. Photo: Maxwell Hamilton, CC BY 2.0 · Flickr
  30. Harmondsworth · Harmondsworth Village Green , London.. Photo: Jim Linwood, CC BY 2.0 · Flickr
  31. Hayes · Stockley Park Bridge. Photo: Matt From London, CC BY 2.0 · Flickr
  32. Uxbridge · Connect Sculpture at Brunel University. Photo: Matt Brown, CC BY 2.0 · Wikimedia Commons
  33. Cranford · St Dunstan's Church Tower. Photo: Maxwell Hamilton, CC BY 2.0 · Flickr
  34. Harmondsworth · Harmondsworth Hall, London.. Photo: Jim Linwood, CC BY 2.0 · Flickr
  35. Uxbridge · Brunel University Sign 2010-09-19. Photo: Ashley Basil, CC BY 2.0 · Wikimedia Commons
  36. Cranford · St Dunstans Church. Photo: Maxwell Hamilton, CC BY 2.0 · Flickr
  37. Harmondsworth · The Five Bells Pub, Harmondsworth, London. Photo: Jim Linwood, CC BY 2.0 · Flickr
  38. Uxbridge · Bakers Yard and High Street, Uxbridge, London (1). Photo: Robert of England, CC BY 2.0 · Wikimedia Commons
  39. Cranford · St Dunstans Church. Photo: Maxwell Hamilton, CC BY 2.0 · Flickr
  40. Harmondsworth · The Crown Pub, Harmondsworth, London.. Photo: Jim Linwood, CC BY 2.0 · Flickr
  41. Uxbridge · Flamingos in Uxbridge Station. Photo: Matt From London, CC BY 2.0 · Flickr
  42. Cranford · Cranford Cottages. Photo: Reading Tom, CC BY 2.0 · Flickr
  43. Uxbridge · Stained Glass of Uxbridge Station. Photo: Matt From London, CC BY 2.0 · Flickr
  44. Uxbridge · Uxbridge Underground Station. Photo: interbeat, CC BY 2.0 · Flickr

Sources and notes

CrimesLog sources crime incident data as published by the UK Home Office through their national data portal at data.police.uk and licensed under their Open Government Licence v3.0. Reported crime incidents originate from individual Territorial Police Forces of England, Wales and Northern Ireland

Contains ONS data © Crown copyright and database right. Contains NISRA data © Crown copyright. Licensed under the Open Government Licence v3.0.

First-place medal: 1st Place Medal emoji icon by Icons8.

Neighbourhood areas derived by CrimesLog from rail station locations (NaPTAN, Department for Transport) and OS Open Names. Contains OS data © Crown copyright and database right 2024; contains public sector information licensed under the Open Government Licence v3.0. The photographs are credited under each picture.

Rates are recorded crimes per 1,000 residents, quarter by quarter; where a neighbourhood has fewer than 100 residents the rate would be worked out on 100 (those places are left out of the race). A count of recorded crime is not a verdict on any neighbourhood.