Los Angeles, California · Neighborhood crime trends

Los Angeles San Fernando Valley and Verdugos

31 neighborhoods - a quarterly race to the lowest crime rate.

Crime Trends: Neighborhoods compared - each quarter from Q1 2022

Los Angeles as a whole averaged 14.4 crimes for every 1,000 residents per quarter in Q2 2026, while San Fernando Valley and Verdugos averaged 10.9 (leaving out 2 places with almost no residents), hence it is generally safer when all crimes are considered.

How do the 31 neighborhoods of San Fernando Valley and Verdugos compare? In Q2 2026 the police recorded 15,921 crimes across them, 10.9 for every 1,000 residents. That is 8.7% below a year earlier and 2.6% below Q1 2022, the first quarter we track.

Sunland has the lowest rate of the everyday neighborhoods (5.7 per 1,000), followed by Shadow Hills (5.8) and Porter Ranch (6.5). North Hollywood has the highest (18.0).

Use the RACE CHARTS below to watch all 31 LOS ANGELES SAN FERNANDO VALLEY AND VERDUGOS NEIGHBORHOODs race across 18 quarter periods from Q1 2022 to Q2 2026 - one crime category at a time or all together. The race chart can be used to compare average crime rates by category against Los Angeles's average.

Neighborhood boundaries are defined by Mapping L.A. (Los Angeles Times, CC BY 4.0) and simplified by CrimesLog.
Lowest rate (everyday)
lowest rateSunland
5.7 crimes per 1,000 residents, Q2 2026
Highest rate
upNorth Hollywood
18.0 per 1,000, Q2 2026
Whole area, Q2 2026
10.9 per 1,000
down 8.7% below a year earlier · down 2.6% below Q1 2022
Compared
31 neighborhoods
1,460,882 residents · 18 quarters

Los Angeles San Fernando Valley and Verdugos neighborhood quarterly crime race

Press ▶︎ to watch Q1 2022 to Q2 2026. Tick one crime category or several; hover a bar for the neighborhood. Property crimes includes burglaries and thefts.

Crime categories
Indicated: crimes rate per 1000 residents per quarterAll · safest at the top · square-root scale · Q1 2022 to Q2 20260151025501007.1Arleta12.6Canoga Park10.1Chatsworth11.6Encino8.1Granada Hills11.2Lake Balboa8.8Lake View Terrace11.4Mission Hills11.7North Hills16.6North Hollywood12.8Northridge9.9Pacoima11.7Panorama City7.1Porter Ranch11.9Reseda155Sepulveda Basin10.7Shadow Hills12.5Sherman Oaks13.0Studio City10.9Sun Valley9.4Sunland9.3Sylmar10.6Tarzana11.6Toluca Lake7.4Tujunga10.7Valley Glen10.8Valley Village13.1Van Nuys7.1West Hills10.4Winnetka11.4Woodland HillsLos Angeles Q2 2026 average all crimes (14.4)Numbers are crimes per 1,000 residents per quarter. Zero-crime quarters show 0 and rank safest. Not included, no residents: Chatsworth Reservoir; Hansen Dam.
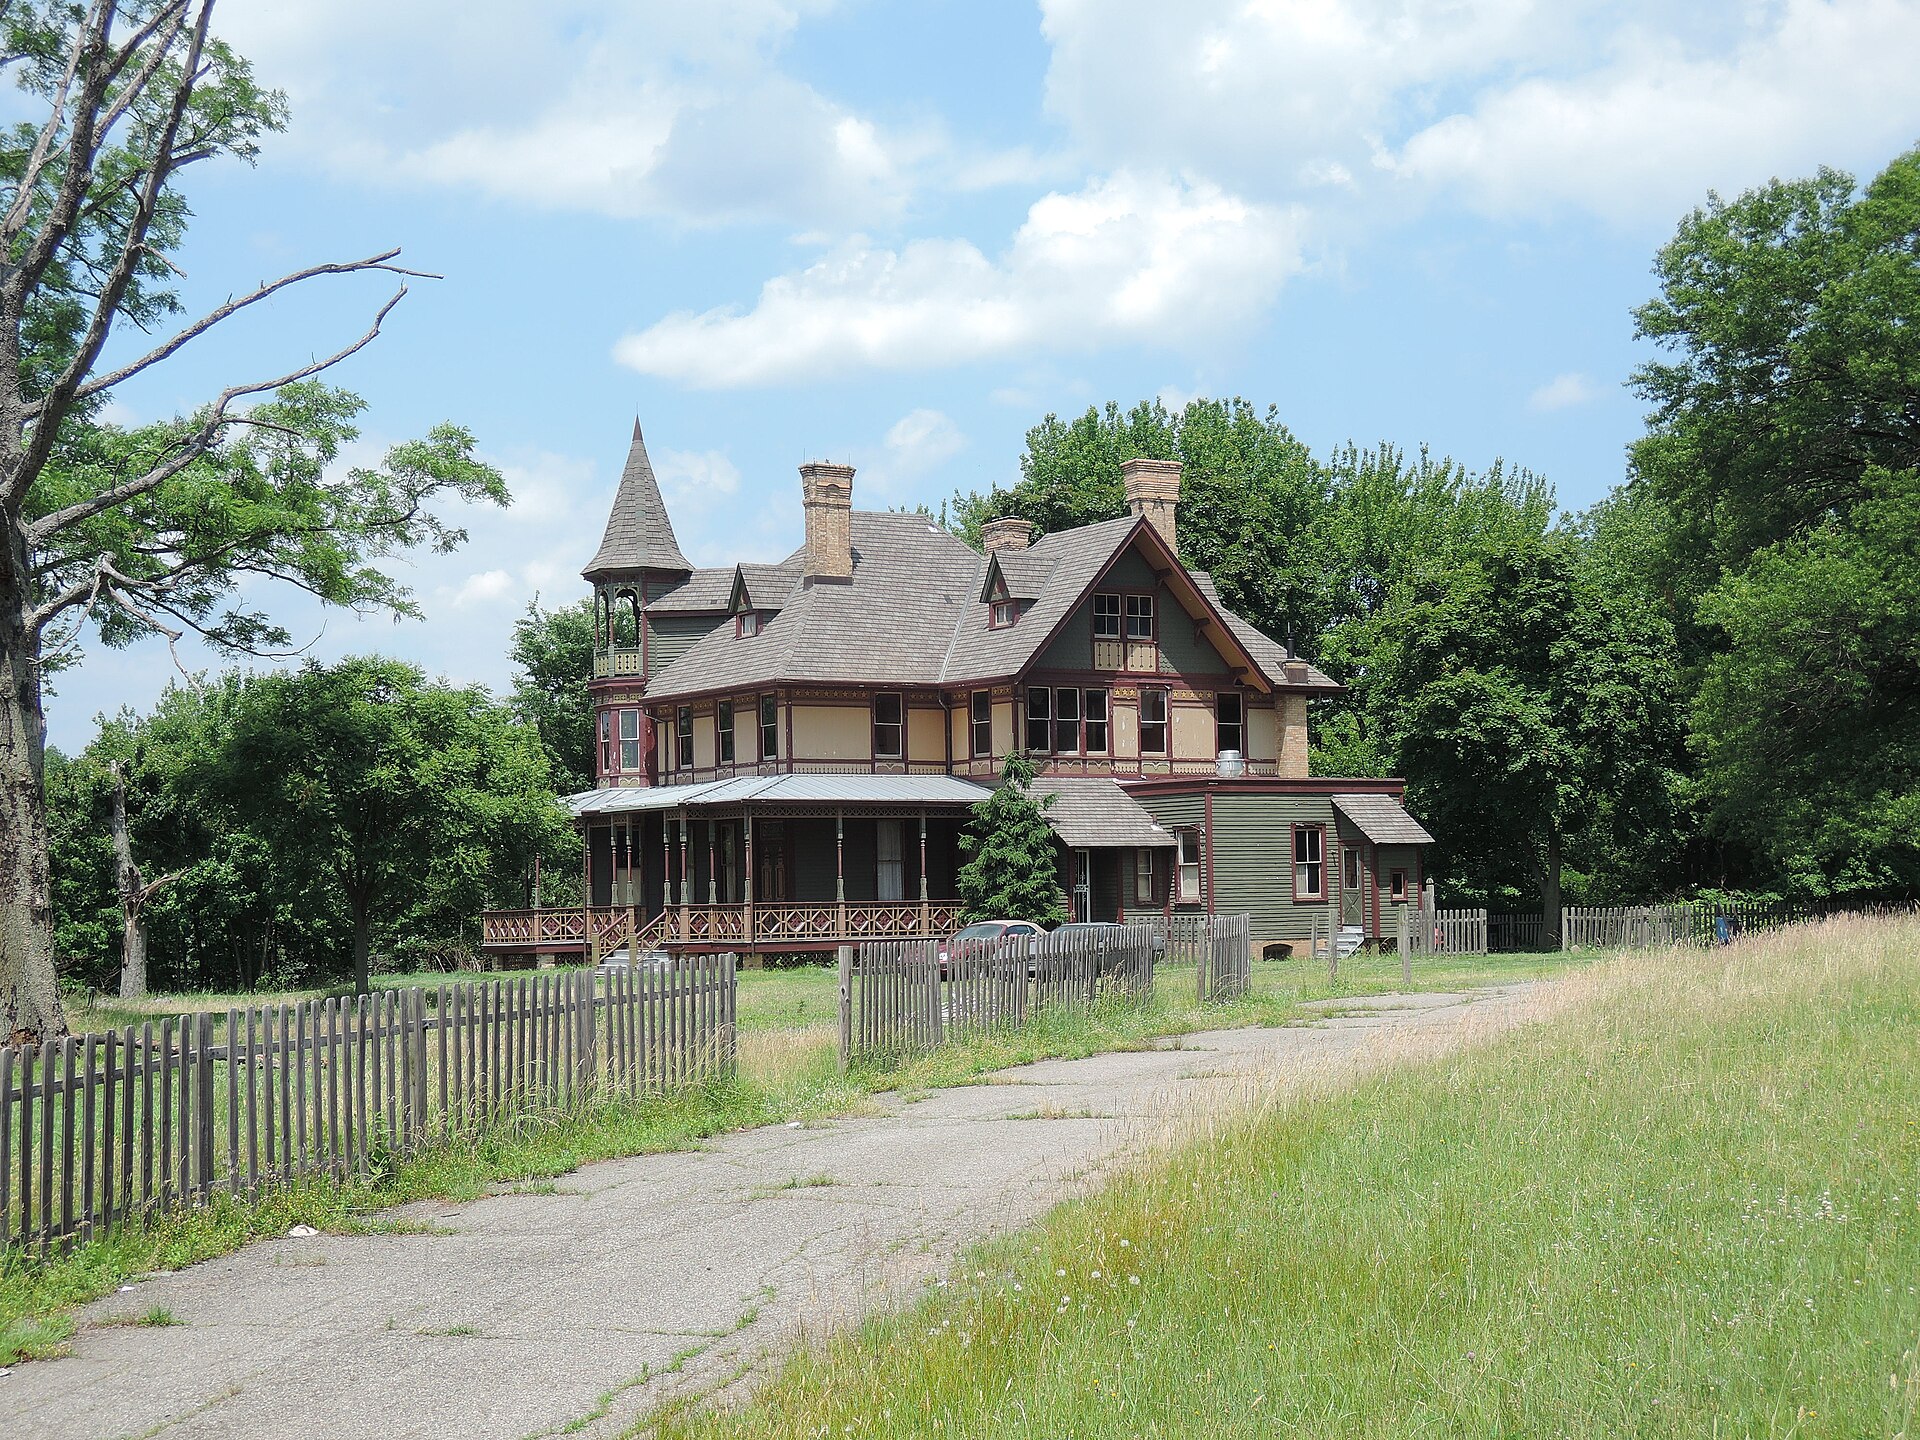
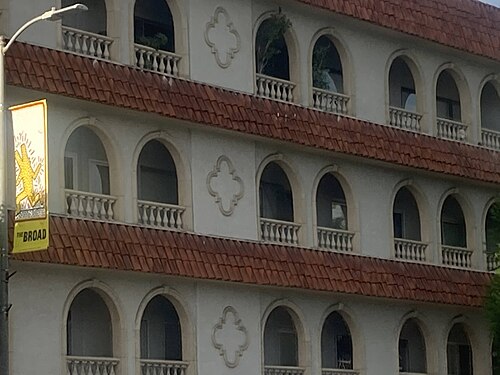
Kreischer House Uncut, Tottenville-Charleston You checked the neighborhood.Now check an address ! Photo: Jim.henderson, CC0 · Wikimedia Commons

For $34.00 a CrimesLog™ Home Report provides: (where available)

  • Nearest 6 Pre-school Nurseries to Address
  • Nearest 6 Primary Schools to Address
  • Nearest 6 Secondary/High Schools to Address
  • Nearest College and University to Address
  • Nearest to Address Medical Clinics, Hospitals and Pharmacies
  • Nearest 2 Police Station details to Address

The Home Report also provides

  • The CrimesLog™ Home Score is a proprietary Home Safety Measure capturing crime frequency, severity, recency and proximity to Address from police crime reporting point
  • A map indicating police anonymized crime reporting points around Address
  • Crime category trendlines for Address neighborhood
  • List of Reported Crime Incidents around Address radius
  • Downloadable PDF report — A Permanent Copy to Keep and Share to aid your Property Research
  • Our crimes database of almost 60 million records is UPDATED EVERY MONTH from US, UK, CA police sources
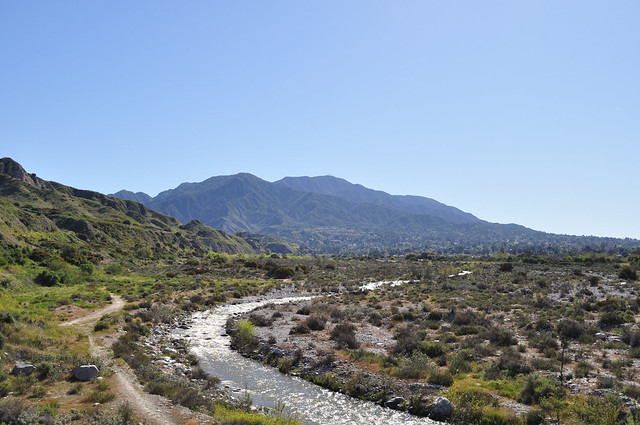
01 Big Tujunga Creek Seen From A Bridge On Foothill Boulevard In Sunland, Los Angeles City, Sunland
Sunland · 01 Big Tujunga Creek Seen From A Bridge On Foothill Boulevard In Sunland, Los Angeles City
Photo: The Fun Chronicles, CC0 · Flickr
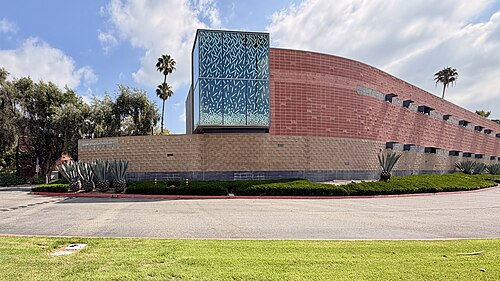
Julius Schulman Institute (Woodbury University), Shadow Hills
Shadow Hills · Julius Schulman Institute (Woodbury University)
Photo: Alexis Doine, CC0 · Wikimedia Commons
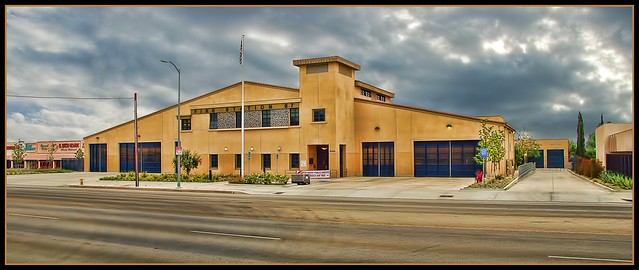
Fire Station 87, Granada Hills
Granada Hills · Fire Station 87
Photo: Chris Yarzab, CC BY 2.0 · Flickr
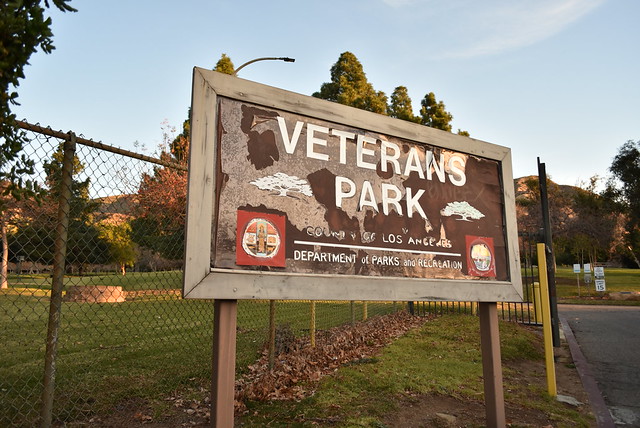
01 Veterans Memorial Community Regional Park, Sylmar, Los Angeles City, Sylmar
Sylmar · 01 Veterans Memorial Community Regional Park, Sylmar, Los Angeles City
Photo: The Fun Chronicles, CC0 · Flickr
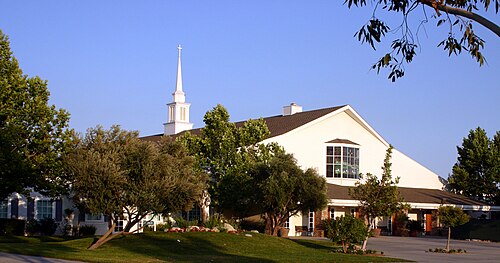
Shepherd-of-the-Hills-Church-Porter-Ranch-CA, Chatsworth
Chatsworth · Shepherd-of-the-Hills-Church-Porter-Ranch-CA
Photo: Dcaudillo, Public domain · Wikimedia Commons
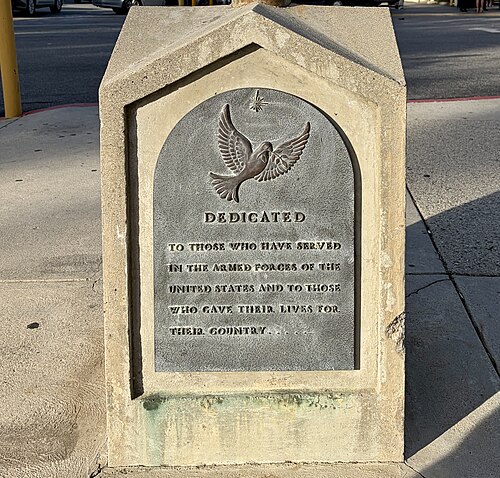
Plaque Commemorating United States Armed Forces (St Peter Armenian Apostolic Church, Van Nuys, Los Angeles), Lake Balboa
Lake Balboa · Plaque Commemorating United States Armed Forces (St Peter Armenian Apostolic Church, Van Nuys, Los Angeles)
Photo: Alexis Doine, CC0 · Wikimedia Commons
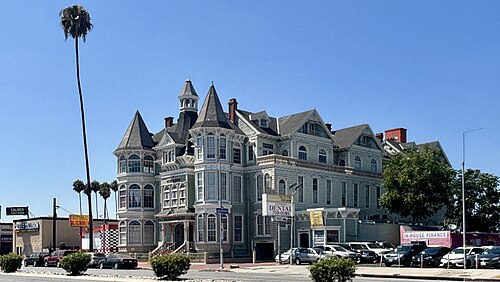
The Victorian Building, Los Angeles, August 2025, Winnetka
Winnetka · The Victorian Building, Los Angeles, August 2025
Photo: Alexis Doine, CC0 · Wikimedia Commons
San Fernando Valley CA 20230731 (103), Encino
Encino · San Fernando Valley CA 20230731 (103)
Photo: Sony 1992, CC0 · Wikimedia Commons

How neighborhoods moved each quarter

2022

Whole-area crime rate 11.2 to 11.8 per 1,000 (high: Q2 2022).

Big moves (4+ places in a quarter): moved down Arleta 1st→5th (Q2) moved up Toluca Lake 21st→9th (Q2) moved up Lake Balboa 17th→10th (Q2) moved up North Hills 23rd→15th (Q2) moved down Winnetka 11th→17th (Q2) moved down Sun Valley 16th→24th (Q2) moved down Tarzana 12th→28th (Q2) moved up Lake View Terrace 7th→1st (Q3) moved down Tujunga 1st→6th (Q3) moved up Encino 18th→10th (Q3) moved down Toluca Lake 9th→13th (Q3) moved down Pacoima 11th→15th (Q3) moved down North Hills 15th→19th (Q3) moved up Tarzana 28th→24th (Q3) moved down Reseda 22nd→27th (Q3) moved down Lake View Terrace 1st→5th (Q4) moved up Toluca Lake 13th→6th (Q4) moved up Pacoima 15th→10th (Q4) moved down Tujunga 6th→11th (Q4) moved up Chatsworth 16th→12th (Q4) moved down Valley Village 9th→14th (Q4) moved up Mission Hills 20th→16th (Q4) moved up Reseda 27th→22nd (Q4) moved down Encino 10th→24th (Q4)

2023

Whole-area crime rate 11.1 to 11.7 per 1,000 (high: Q4 2023).

Big moves (4+ places in a quarter): moved up Winnetka 17th→9th (Q1) moved down Toluca Lake 6th→11th (Q1) moved down Valley Glen 15th→19th (Q1) moved up Encino 24th→20th (Q1) moved down Studio City 23rd→27th (Q1) moved up Tujunga 8th→2nd (Q2) moved up Mission Hills 18th→7th (Q2) moved down Lake View Terrace 6th→10th (Q2) moved down Winnetka 9th→13th (Q2) moved down Toluca Lake 11th→16th (Q2) moved up Panorama City 23rd→18th (Q2) moved down Sun Valley 17th→21st (Q2) moved up Lake View Terrace 10th→6th (Q3) moved up Toluca Lake 16th→7th (Q3) moved up Sun Valley 21st→12th (Q3) moved up Chatsworth 17th→13th (Q3) moved down Pacoima 9th→15th (Q3) moved down Mission Hills 7th→17th (Q3) moved up Encino 23rd→18th (Q3) moved down North Hills 14th→19th (Q3) moved down Panorama City 18th→22nd (Q3) moved up Studio City 28th→24th (Q3) moved up Shadow Hills 8th→1st (Q4) moved up West Hills 9th→5th (Q4) moved up Pacoima 15th→8th (Q4) moved up Chatsworth 13th→9th (Q4) moved up Mission Hills 17th→10th (Q4) moved down Sunland 3rd→14th (Q4) moved up Reseda 23rd→15th (Q4) moved down Toluca Lake 7th→17th (Q4) moved down Valley Village 14th→20th (Q4) moved down Sun Valley 12th→21st (Q4) moved down Studio City 24th→28th (Q4)

2024

Whole-area crime rate 11.0 to 12.0 per 1,000 (high: Q3 2024).

Big moves (4+ places in a quarter): moved up Sunland 14th→3rd (Q1) moved down Shadow Hills 1st→6th (Q1) moved up Toluca Lake 17th→12th (Q1) moved up Valley Village 20th→14th (Q1) moved down Chatsworth 9th→15th (Q1) moved up Panorama City 22nd→16th (Q1) moved down Mission Hills 10th→17th (Q1) moved down Reseda 15th→19th (Q1) moved down Valley Glen 18th→22nd (Q1) moved down Encino 19th→24th (Q1) moved up Canoga Park 29th→25th (Q1) moved down Northridge 25th→29th (Q1) moved down Arleta 2nd→6th (Q2) moved up Valley Village 14th→8th (Q2) moved up Chatsworth 15th→9th (Q2) moved down Shadow Hills 6th→10th (Q2) moved up North Hills 18th→14th (Q2) moved down Granada Hills 11th→15th (Q2) moved down Lake Balboa 10th→18th (Q2) moved down Sun Valley 20th→24th (Q2) moved up Granada Hills 15th→7th (Q3) moved down Sylmar 5th→9th (Q3) moved up Lake Balboa 18th→14th (Q3) moved up Reseda 22nd→15th (Q3) moved up Sun Valley 24th→18th (Q3) moved down Toluca Lake 12th→19th (Q3) moved down North Hills 14th→23rd (Q3) moved down Mission Hills 16th→25th (Q3) moved up Sylmar 9th→5th (Q4) moved down Valley Village 8th→14th (Q4) moved up North Hills 23rd→17th (Q4) moved up Mission Hills 25th→21st (Q4) moved down Valley Glen 17th→23rd (Q4) moved down Toluca Lake 19th→24th (Q4)

2025

Whole-area crime rate 11.2 to 11.9 per 1,000 (high: Q2 2025).

Big moves (4+ places in a quarter): moved up Valley Village 14th→10th (Q1) moved up Toluca Lake 24th→17th (Q1) moved down Mission Hills 21st→26th (Q1) moved up Shadow Hills 9th→3rd (Q2) moved down Arleta 3rd→7th (Q2) moved down Lake View Terrace 2nd→8th (Q2) moved down Valley Glen 22nd→26th (Q2) moved down Shadow Hills 3rd→8th (Q3) moved up Lake Balboa 14th→9th (Q3) moved down Lake View Terrace 8th→12th (Q3) moved up Sun Valley 18th→14th (Q3) moved down Winnetka 12th→17th (Q3) moved up Lake View Terrace 12th→5th (Q4) moved up Winnetka 17th→13th (Q4) moved up Encino 20th→14th (Q4) moved down Sun Valley 14th→18th (Q4) moved down Valley Village 13th→19th (Q4)

2026

Whole-area crime rate 10.9 to 10.9 per 1,000 (high: Q1 2026). 2 quarters so far.

Big moves (4+ places in a quarter): moved down Arleta 3rd→8th (Q1) moved up Valley Village 19th→13th (Q1) moved down Panorama City 16th→21st (Q1) moved up Mission Hills 26th→22nd (Q1) moved up Sunland 5th→1st (Q2) moved up Shadow Hills 6th→2nd (Q2) moved up Granada Hills 10th→6th (Q2) moved down West Hills 3rd→9th (Q2) moved up Sherman Oaks 25th→20th (Q2) moved up Tarzana 26th→21st (Q2) moved down Reseda 17th→24th (Q2)

Reported Safety Incidents

In Q2 2026: property incidents were 39% (6,148), vehicle crimes were 23% (3,679), violent incidents were 23% (3,647) and public order incidents were 14% (2,206).

Recorded crime here is grouped into violent crime, property crime (burglary and theft), vehicle crime and public order offences, so you can compare how safe each neighborhood is for the kind of crime that matters to you.

Read category comparisons with care. A category that jumps while the total hardly moves looks like a change in how offences are classified, not in what happened: Q1 2025: public order up 37% while the total moved 1%. The whole-area rate is the steadier guide.

Places we left out, and places to read with care

Left out: Chatsworth Reservoir; Hansen Dam. They have almost no residents: their crimes are against visitors, so a rate per resident says little about living there.

Sepulveda Basin (263.6 per 1,000 from 87 crimes among 330 residents) is a place with few residents (under 3,000): a rate on so few people says little about living there, so it is not named as the lowest or highest.

The 31 neighborhoods on the map

San Fernando Valley and Verdugos is made of 31 neighborhoods compared here, each in its own colour on the map. They are the neighborhoods of Mapping L.A. (Los Angeles Times, CC BY 4.0), grouped into five areas of the city by CrimesLog: 1,460,882 residents between them.

  • Arleta
  • Canoga Park
  • Chatsworth
  • Encino
  • Granada Hills
  • Lake Balboa
  • Lake View Terrace
  • Mission Hills
  • North Hills
  • North Hollywood
  • Northridge
  • Pacoima
  • Panorama City
  • Porter Ranch
  • Reseda
  • Sepulveda Basin
  • Shadow Hills
  • Sherman Oaks
  • Studio City
  • Sun Valley
  • Sunland
  • Sylmar
  • Tarzana
  • Toluca Lake
  • Tujunga
  • Valley Glen
  • Valley Village
  • Van Nuys
  • West Hills
  • Winnetka
  • Woodland Hills

All 31 neighborhoods, Q2 2026

Crimes per 1,000 residents, Q2 2026, lowest first. The last two columns compare with Q1 2022.
#NeighborhoodResidentsAllViolentPropertyVehiclePublic orderRate vs Q1 2022Places gained
1Sunland16,3715.71.01.61.90.9down40%up7
2Shadow Hills14,9275.81.22.21.50.7down46%up12
3Porter Ranch25,0996.51.23.21.30.6down8%down1
4Tujunga27,5276.51.12.61.90.7down12%–
5Arleta31,0847.11.62.12.21.0up1%down4
6Granada Hills55,5327.21.62.82.10.7down12%down1
7Lake View Terrace11,9797.21.22.71.81.3down19%down1
8Sylmar80,6317.52.22.02.01.1down20%down1
9West Hills42,7147.61.34.11.21.0up7%down6
10Valley Village28,0828.51.53.42.80.7down21%up5
11Chatsworth49,6458.81.63.22.01.8down12%down1
12Pacoima74,4059.32.62.62.31.5down6%down3
13Lake Balboa25,4579.61.93.13.21.2down15%up4
14Winnetka50,0719.62.53.22.21.6down8%down3
15Encino47,2019.61.44.82.31.0down17%up5
16Woodland Hills72,30710.52.34.72.60.9down8%up2
17Valley Glen56,27410.83.13.92.81.0up1%down4
18Sun Valley72,66810.92.73.13.31.5down0%down2
19Toluca Lake9,71811.11.35.92.61.3down4%up2
20Sherman Oaks69,48611.12.25.52.50.8down11%up5
21Tarzana37,96711.12.74.92.01.4up5%down9
22Mission Hills19,45911.22.84.22.41.6down2%down3
23Panorama City65,06911.43.24.22.21.6down2%down1
24Reseda68,59811.73.13.92.52.1down2%–
25North Hills56,62511.92.75.02.31.6up2%down2
26Northridge65,67713.12.55.42.72.1up2%up1
27Studio City41,47813.52.07.33.01.0up4%up1
28Van Nuys108,97014.43.74.53.42.4up10%up1
29Canoga Park60,39814.82.87.62.41.9up18%down3
30North Hollywood75,13318.04.46.33.73.4up8%–
31Sepulveda Basin †330263.678.881.866.736.4up71%–

† Sepulveda Basin is a place with few residents. A rate on a very small number of residents or crimes is not comparable with the others.

Photographs

76 photographs of the 31 neighborhoods run along the reel; click one to see it full size. Each is credited here and under the large view.

All 76 photographs and their credits
  1. Sunland · 01 Big Tujunga Creek Seen From A Bridge On Foothill Boulevard In Sunland, Los Angeles City. Photo: The Fun Chronicles, CC0 · Flickr
  2. Shadow Hills · Julius Schulman Institute (Woodbury University). Photo: Alexis Doine, CC0 · Wikimedia Commons
  3. Granada Hills · Fire Station 87. Photo: Chris Yarzab, CC BY 2.0 · Flickr
  4. Sylmar · 01 Veterans Memorial Community Regional Park, Sylmar, Los Angeles City. Photo: The Fun Chronicles, CC0 · Flickr
  5. Chatsworth · Shepherd-of-the-Hills-Church-Porter-Ranch-CA. Photo: Dcaudillo, Public domain · Wikimedia Commons
  6. Lake Balboa · Plaque Commemorating United States Armed Forces (St Peter Armenian Apostolic Church, Van Nuys, Los Angeles). Photo: Alexis Doine, CC0 · Wikimedia Commons
  7. Winnetka · The Victorian Building, Los Angeles, August 2025. Photo: Alexis Doine, CC0 · Wikimedia Commons
  8. Encino · San Fernando Valley CA 20230731 (103). Photo: Sony 1992, CC0 · Wikimedia Commons
  9. Woodland Hills · Corbin Palms Model H-3, Woodland Hills, Los Angeles. Photo: Alexis Doine, CC0 · Wikimedia Commons
  10. Valley Glen · Denny's Restaurant (Sherman Way). Photo: Alexis Doine, CC0 · Wikimedia Commons
  11. Sun Valley · LA-HCM 644 Stone House 8642 Sunland Boulevard (2014). Photo: Junkyardsparkle, CC0 · Wikimedia Commons
  12. Toluca Lake · Charles Borromeo Church (North Hollywood), Cupola. Photo: Alexis Doine, CC0 · Wikimedia Commons
  13. Sherman Oaks · Denny's. Photo: Clotee Pridgen Allochuku from Sherman Oaks, California, United States, CC BY 2.0 · Wikimedia Commons
  14. Tarzana · St Mary's Assyrian Church, Tarzana, Los Angeles (2026). Photo: Alexis Doine, CC0 · Wikimedia Commons
  15. Panorama City · Mi Tierra Restaurante (Salvadoran Style) by Night, Roscoe Bld, Los Angeles. Photo: Alexis Doine, CC0 · Wikimedia Commons
  16. Reseda · Kirk School, Los Angeles. Photo: Alexis Doine, CC0 · Wikimedia Commons
  17. North Hills · Regency Theatres Granada Hills (Entrance). Photo: Alexis Doine, CC0 · Wikimedia Commons
  18. Northridge · Painted House. Photo: Sheila Sund from Salem, United States, CC BY 2.0 · Wikimedia Commons
  19. Studio City · Charles Borromeo Church (North Hollywood). Photo: Alexis Doine, CC0 · Wikimedia Commons
  20. Van Nuys · La Iglesia En El Camino (Van Nuys) Oct. 2024. Photo: Alexis Doine, CC0 · Wikimedia Commons
  21. Canoga Park · Los Angeles CA 20230827 (292). Photo: Sony 1992, CC0 · Wikimedia Commons
  22. North Hollywood · Jesus Sacred Heart Church (Syriac Catholic), North Hollywood, Los Angeles (2026). Photo: Alexis Doine, CC0 · Wikimedia Commons
  23. Shadow Hills · St. Leon Cathedral. Photo: Alexis Doine, CC0 · Wikimedia Commons
  24. Chatsworth · SR27 Topanga Canyon Boulevard from Stoney. Photo: Junkyardsparkle, CC0 · Wikimedia Commons
  25. Lake Balboa · Fire Station No. 100 (Los Angeles, California). Photo: Alexis Doine, CC0 · Wikimedia Commons
  26. Encino · San Fernando Valley CA 20230731 (105). Photo: Sony 1992, CC0 · Wikimedia Commons
  27. Woodland Hills · Los Angeles CA 20230827 (102). Photo: Sony 1992, CC0 · Wikimedia Commons
  28. Sun Valley · Woodbury University (Entrance). Photo: Alexis Doine, CC0 · Wikimedia Commons
  29. Toluca Lake · East Valley High School North Hollywood 2016-03-20. Photo: Junkyardsparkle, CC0 · Wikimedia Commons
  30. Tarzana · Saint Mary's Assyrian Church, Tarzana, Los Angeles. Photo: Alexis Doine, CC0 · Wikimedia Commons
  31. Panorama City · Los 7 Mares. Photo: Chris Yarzab, CC BY 2.0 · Wikimedia Commons
  32. Reseda · Plaque West Valley Municipal Building (Reseda, LA). Photo: Alexis Doine, CC0 · Wikimedia Commons
  33. North Hills · Regency Theatres Granada Hills. Photo: Alexis Doine, CC0 · Wikimedia Commons
  34. Northridge · Northridge Metrolink Station Looking Westward. Photo: Junkyardsparkle, CC0 · Wikimedia Commons
  35. Studio City · Universal Studios Gate 3 Lankershim 2015-04-19. Photo: Junkyardsparkle, CC0 · Wikimedia Commons
  36. Van Nuys · Saint Peter Armenian Apostolic Church, Van Nuys, Los Angeles. Photo: Alexis Doine, CC0 · Wikimedia Commons
  37. Canoga Park · Los Angeles CA 20230827 (14). Photo: Sony 1992, CC0 · Wikimedia Commons
  38. North Hollywood · Jesus Sacred Heart Church (Syriac Catholic), North Hollywood, Los Angeles. Photo: Alexis Doine, CC0 · Wikimedia Commons
  39. Lake Balboa · Church of God Ministry of Jesus Christ International, Los Angeles. Photo: Alexis Doine, CC0 · Wikimedia Commons
  40. Encino · San Fernando Valley CA 20230731 (106). Photo: Sony 1992, CC0 · Wikimedia Commons
  41. Woodland Hills · Los Angeles, CA, USA. Photo: Mountain Mike Johans…, CC BY 3.0 · Wikimedia Commons
  42. Sun Valley · Wat Thai of Los Angeles (Sun Valley), Oct. 2024. Photo: Alexis Doine, CC0 · Wikimedia Commons
  43. Toluca Lake · Case Study House No. 1 View from Street 2014. Photo: Junkyardsparkle, CC0 · Wikimedia Commons
  44. Tarzana · St John's Lutheran Church, Tarzana (3). Photo: Alexis Doine, CC0 · Wikimedia Commons
  45. Reseda · Grace Shepherdship Church, Reseda, Los Angeles. Photo: Alexis Doine, CC0 · Wikimedia Commons
  46. North Hills · View of Valley from North Hills VA Hospital. Photo: atomickatz, CC BY 3.0 · Wikimedia Commons
  47. Northridge · CSUN. Photo: Guanzhan Chen, CC BY 3.0 · Wikimedia Commons
  48. Studio City · 3424 West Adams Boulevard - Lycurgus Lindsay House - 14 of 37. Photo: Unknown authorUnknown author, Public domain · Wikimedia Commons
  49. Canoga Park · Los Angeles CA 20230827 (104). Photo: Sony 1992, CC0 · Wikimedia Commons
  50. North Hollywood · Masonic Temple, North Hollywood, CA. Photo: Downtowngal, CC0 · Wikimedia Commons
  51. Lake Balboa · Saint Peter Armenian Apostolic Church, Van Nuys, Los Angeles (January 2026). Photo: Alexis Doine, CC0 · Wikimedia Commons
  52. Woodland Hills · Los Angeles CA 20230827 (113). Photo: Sony 1992, CC0 · Wikimedia Commons
  53. Sun Valley · Coldwater Canyon Avenue, Sun Valley (Los Angeles) October 2024. Photo: Alexis Doine, CC0 · Wikimedia Commons
  54. Tarzana · Grace Hungarian Reformed Church, Los Angeles. Photo: Alexis Doine, CC0 · Wikimedia Commons
  55. Reseda · Lindley Avenue, Los Angeles, California. Photo: Alexis Doine, CC0 · Wikimedia Commons
  56. Northridge · AMC Northridge 10, Los Angeles (Interior). Photo: Alexis Doine, CC0 · Wikimedia Commons
  57. Canoga Park · Los Angeles CA 20230827 (107). Photo: Sony 1992, CC0 · Wikimedia Commons
  58. North Hollywood · The Home Depot. Photo: Chris Yarzab, CC BY 2.0 · Wikimedia Commons
  59. Lake Balboa · Bull Creek North from Victory. Photo: Junkyardsparkle, CC0 · Wikimedia Commons
  60. Woodland Hills · Corbin Palms House, Woodland Hills, Los Angeles. Photo: Alexis Doine, CC0 · Wikimedia Commons
  61. Tarzana · Tabu Shabu Tarzana, Los Angeles. Photo: Alexis Doine, CC0 · Wikimedia Commons
  62. Reseda · MTO Shahmaghsoudi (School of Islamic Sufism), Reseda, Los Angeles. Photo: Alexis Doine, CC0 · Wikimedia Commons
  63. North Hollywood · The Group Rep at the Lonny Chapman Theatre. Photo: Alexis Doine, CC0 · Wikimedia Commons
  64. Lake Balboa · St Michael Community Center, Van Nuys, Los Angeles. Photo: Alexis Doine, CC0 · Wikimedia Commons
  65. Woodland Hills · Corbin Palms House (Plaque), Woodland Hills, Los Angeles. Photo: Alexis Doine, CC0 · Wikimedia Commons
  66. Tarzana · Ventura Boulevard, Tarzana, Los Angeles. Photo: Alexis Doine, CC0 · Wikimedia Commons
  67. Reseda · St. Catherine of Siena Church (August 2025). Photo: Alexis Doine, CC0 · Wikimedia Commons
  68. North Hollywood · Lankershim Boulevard Intersecting Vineland Avenue and Camarillo St. Photo: Junkyardsparkle, CC0 · Wikimedia Commons
  69. Tarzana · Saint Mary's Assyrian Church, Tarzana, Los Angeles (Patio) January 2026 (III). Photo: Alexis Doine, CC0 · Wikimedia Commons
  70. Reseda · West Valley Regional Branch Library, Reseda (July 2025). Photo: Alexis Doine, CC0 · Wikimedia Commons
  71. North Hollywood · Toluca Southern Pacific Depot and Pacific Electric Lankershim Station View from Southwest 2014-11-23. Photo: Junkyardsparkle, CC0 · Wikimedia Commons
  72. Tarzana · Saint Mary's Assyrian Church, Tarzana, Los Angeles (Patio) January 2026 (II). Photo: Alexis Doine, CC0 · Wikimedia Commons
  73. Reseda · West Valley Regional Branch Library, Reseda - Plaque (2002). Photo: Alexis Doine, CC0 · Wikimedia Commons
  74. North Hollywood · Vineland Avenue Looking Southward. Photo: Junkyardsparkle, CC0 · Wikimedia Commons
  75. Reseda · West Valley Municipal Building, Reseda. Photo: Alexis Doine, CC0 · Wikimedia Commons
  76. Reseda · ONE Senior Center, Reseda, Los Angeles. Photo: Alexis Doine, CC0 · Wikimedia Commons

Sources and notes

CrimesLog sources crime incident data published by the Los Angeles Police Department (LAPD) through the City of Los Angeles Open Data Portal (data.lacity.org), containing public sector information released under the Los Angeles Open Data Portal Terms of Use.

Population: U.S. Census Bureau, American Community Survey 5-year estimates (public domain).

First-place medal: 1st Place Medal emoji icon by Icons8.

Neighborhood boundaries are defined by Mapping L.A. (Los Angeles Times, CC BY 4.0), grouped into five areas of the city by CrimesLog and simplified by CrimesLog. The photographs are credited under each picture.

Rates are recorded crimes per 1,000 residents, quarter by quarter; where a neighborhood has fewer than 100 residents the rate would be worked out on 100 (those places are left out of the race). A count of recorded crime is not a verdict on any neighborhood.